Alert can be triggered on a set of metrics.
Usually, it’s not needed to create a metric grouping : it’s automatically created when an alert is created.
It’s useful to check what is the scope of the automatic metric grouping created.
Filtering
The goal of the metric grouping is to filter the metrics and select only those who match the two regular expression :
- Metric Grouping Agent Expressions
- Metric Expressions
The first one Metric Grouping Agent Expressions select the :
- agent Host
- agent Process Name, this is the environment key in HPA (see environment.yml)
- agent name : DataServer, EventServer
As it is a regular expression, you can make some OR logical operation if needed.
The second one Metric Grouping select the metrics, example :
-
GC Monitor:Percentage of Time Spent in GC during last 15 minutes -
Hpa\|ScheduledTask\|.*:Status -
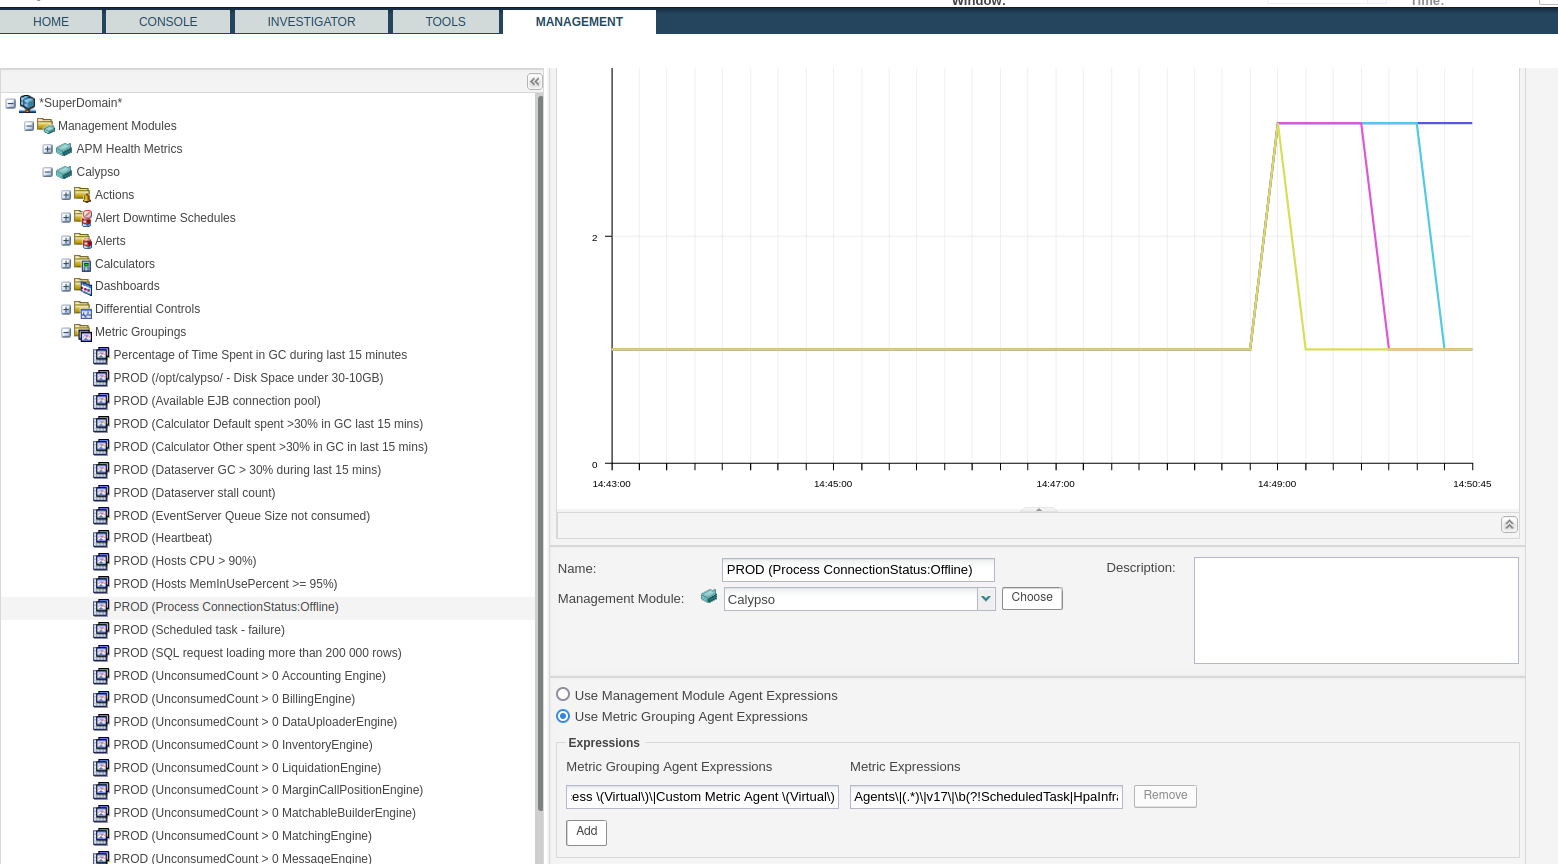
Agents\|(.*)\|v17\|\b(?!ScheduledTask|HpaInfrastructure|Navigator\b).*:ConnectionStatus
As it is a regular expression, you can make some OR logical operation if needed.
The selected metrics are displayed on the graph.
Screenshot