Calypso cache metrics
The metrics are recorded directly from Calypso CacheMetrics object for cache created using CacheUtil.makeCache.
Multiple statistics exists on the Calypso caches, here is an extract :
-
population: number of elements in the cache -
maxSize: the max cache size, this is the limit configured in database or using the dataserver GUI. -
readMetric:requestsand_hitsfor read actions -
writeMetric:requestsand_hitsfor put actions -
removeMetric:requestsand_hitsfor remove actions
Example of Hpa cache metrics
Here is an example of the recorded metrics for 1 cache :
Hpa|Cache|AccountSQL._accountHash:maxSize
Hpa|Cache|AccountSQL._accountHash:population
Hpa|Cache|AccountSQL._accountHash:ReadHitRatio %
Hpa|Cache|AccountSQL._accountHash:ReadRequests
Hpa|Cache|AccountSQL._accountHash:RemoveRequests
Details for HPA cache metrics
Cache name
In dataserver webadmin, the usual display of cache is like this :
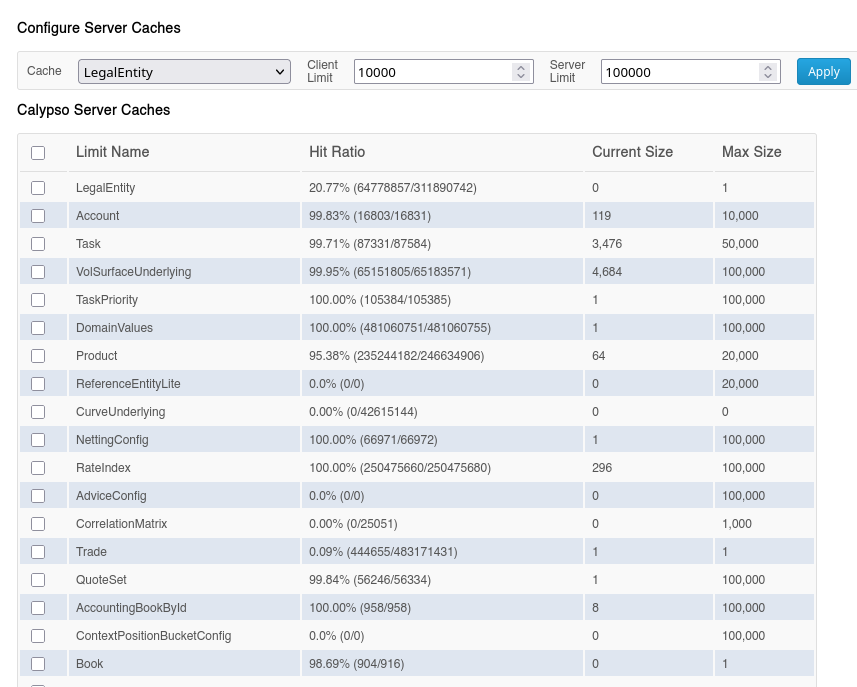
If we focus on Book, there is only 1 line :
- Limit name, here
Book - Hit Ratio, which are the attributes :
hit / requests - Current size, which is
population - Max size, which is
maxSize
This is a direct read of the object describe previously.
What HPA displayed is like this :
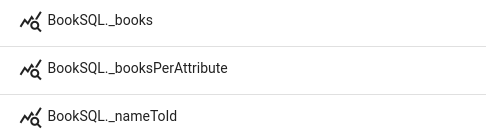
For a given limit, here Book, there is in fact 3 cache objects :
-
_books -
_booksPerAttribute -
_nameTold
Future releases of HPA will displayed the limit name used for the technical cache.
In the dataserver view, only _books statistics are displayed.
Metrics
Every 5 minutes, the caches metrics are read and recorded.
HPA agents iterate over the caches and record :
- population : value is directly recorded at each interval
- maxSize : value is directly recorded at each interval
Absolute or per interval
The following values are recorded per interval, meaning that only the differences between the beginning and the end of the interval is recorded. This is easier to see the evolution of the value.
For example, let’s consider the hits attribute for the ReadMetric which count number a time a cache is read and contains the value for the given key.
| Time | Calypso value | Hpa recorded value |
|---|---|---|
| T0 | 0 | 0 |
| T0 + 5mn | 100 | 100 |
| T0 + 10mn | 200 | 100 |
| T0 + 15mn | 200 (no activity) | 0 |
It’s easier to follow the evolution of the metrics and setup an alert if hitRatio is recorded per interval;
In this example T0 + 15mn is a period where the cache hit ratio was 0 so the alert is easy to setup.
Here are the metrics recorded per interval by the agent :
-
ReadHitRatio %: from readMetric, this is the valuehit / requestsfor the given interval -
ReadRequests: number of time the cache is interrogated for the given interval -
RemoveRequests: number of removes of the cache for the given interval
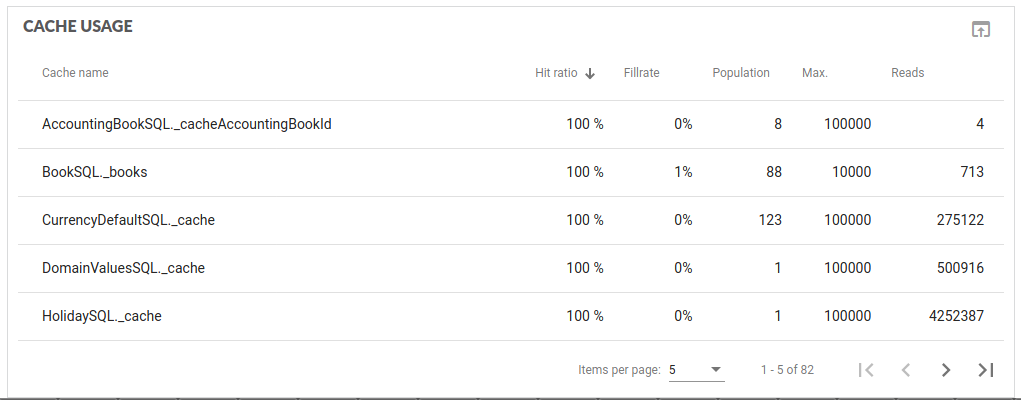
They are mapped like this on the GUI :
- Cache name
- Hit Ratio = the average
ReadHitRatio %on the selected period - Fill rate = compute only on GUI side -
population / maxSize - Population = the average value of
populationfor the selected period - Max. = the maximum value of
maxSizefor the selected period - Reads = sum of
ReadRequests, it is the total number of read on the selected period - Eviction = sum of
RemoveRequests, it is the total number of eviction on the selected period
HPA colors meaning
If the population is over 98% of the maxSize, and the cache name is orange
If an eviction happened on the period, the cache name is red.
Advice on cache management
If the hit ratio is low, consider the benefits of using cache or be sure to correctly fill it.
If the hit ratio is 100% and the population equals the max size (i.e. the fill rate is 100%), consider increasing the cache size.
If evictions are high, consider increasing the cache size.
Always ensure that the code have to use the cache and not a fresh value.
As a limit can be used for different technical caches, ensure that modifying a limit correct the right cache.