As described in the architecture part, we rely on Broacom APM to record and the store the data. The HPA portal get metrics and perform some analysis to display a fast summary and advanced summary of the usage.
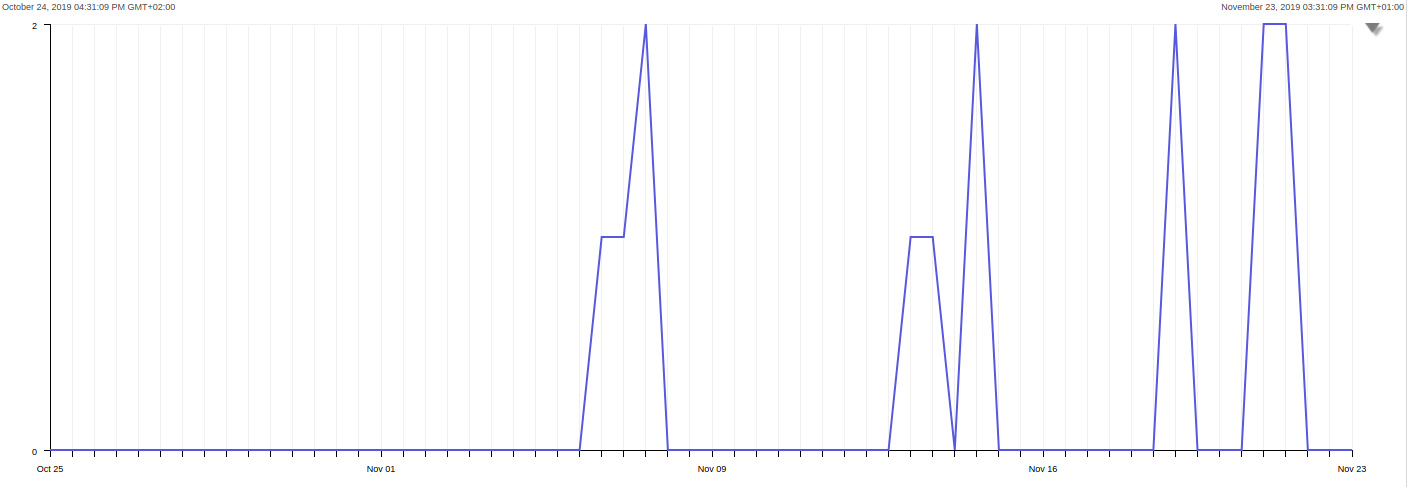
If we need to display a given raw metric (for example the CPU usage over the time for a given module) then we can switch to the webview that can display a time graph for every metrics.
To help the navigation, we put an icon :

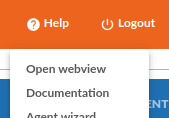
or in the menu Open Webview :
This icon opens the webview, pinpoints the metric in the Investigator tree and set the date. The investigator tree is composed like this :
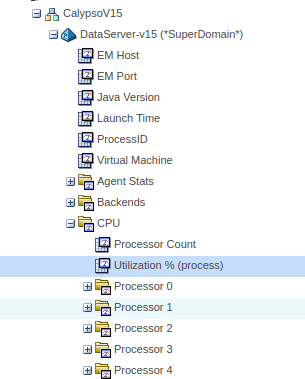
For large environment, there is a node for each jvm :
- navigators
- engine servers
- data servers
- event server
Then we can have timed graph :