Scheduled tasks overview
To analyze the engines activity, this section helps you to identify engine’s activity.
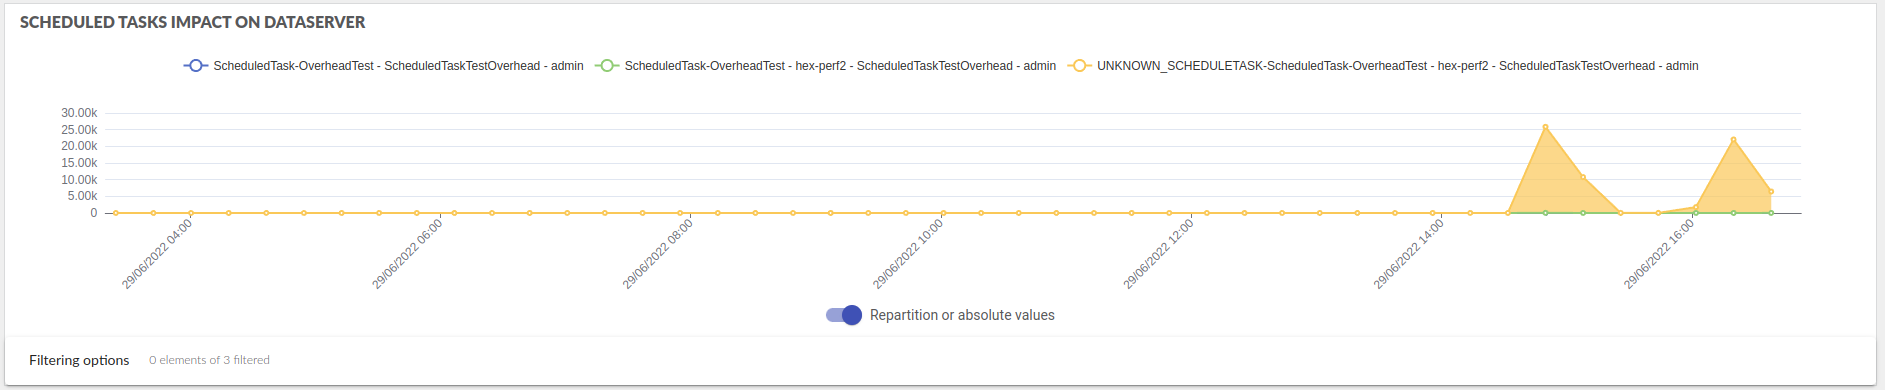
The very first graph is the dataserver activity for the engines group of client. We displayed here the activity per engines. It permits to identify which client consumes dataserver ressources.
This component is described here
Scheduled tasks with no activity
Just under the graph, an expansion panel with title “Elements with no activity on this period…” displays the list of ScheduledTasks that have run since the begining of the monitoring and that have not run during the monitored period of time.
Scheduled tasks with low activity
Just under the graph, an expansion panel with title “Elements with low activity on this period…” displays the list of ScheduledTasks that have run during this period of time, but whose EJB calls to dataServer duration is too low to be displayed. A switch in the expansion panel enables to display these scheduled tasks on the usage graph.
Please note EJB calls to dataServer duration is too low if it falls bellow the duration between two points of the graph, and that the duration between two points of the graph is the duration of the monitored period divided by 60 (the total number of points of the graph)
Detailed information
Just under the graph, a select box allows to select a scheduled task to deep dive in this particular JVM et follow its activity.

Then a new section is displayed: Detailed scheduled task activity
Overview of ScheduledTasks specific metrics