We regroup on this page the main KPI to follow the Calypso activity.
Calypso clients
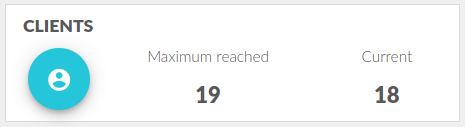
This tile displays the number of connected clients to the dataserver.
- current value : the numbers of connected clients at the end of the selected period (most up-to-date value)
- max value : the maximum number of clients connected during the period
The source values are the same as dataserver tab.
Engine status
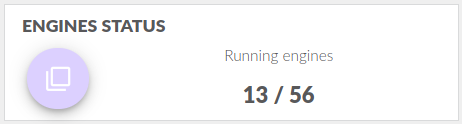
This tile displays the running engines and the total number of engines.
Clicking on the icon open a popup with the detailed engines list.
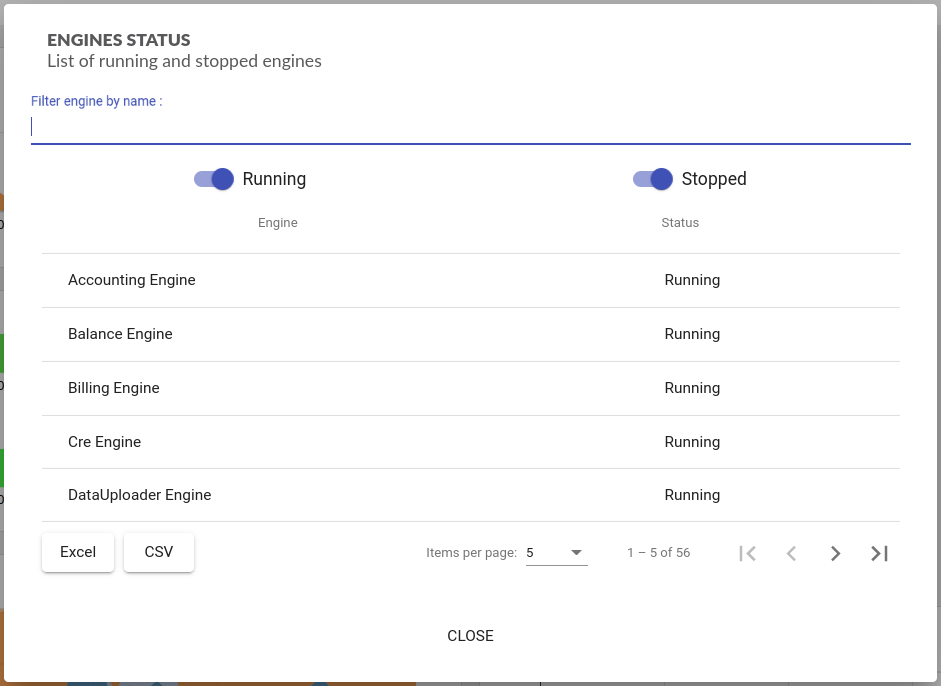
You can filter, export and sort the list of engines.
Calculator grid
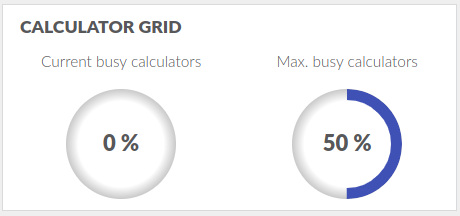
This tile displays the percentage of running calculator in the grid.
- current value : the numbers of calculator running at the end of the selected period (most up-to-date value)
- max value : the maximum number of calculator running at the same time during the period
The source values are the same as riskserver tab.
Events
Calypso exchange a lot of events between its different components :
- JMS Messages (underlying technical part of the PS Events) managed by the event server
- PS Events, the function part of the message and a Calypso layer in top of JMS Message
- Pending events / Unconsummed Events : the engines read immediatly JMS Message/PSEvents from event server and store them into their own queue
Events server
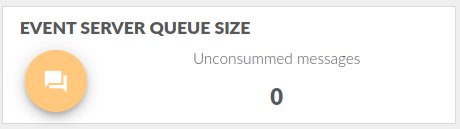
The heart of the event system exchange, all components should consume the messages published on the differents queues and topic. All the queue should be at zero : instant event consumption by client.
PS Events
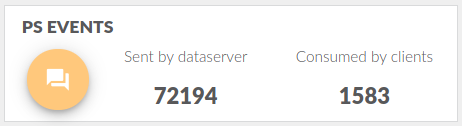
In this tile, the number of psevents sent by dataserver is displayed (the details of psevents is in the dataserver tab). The sum of events consumed by all clients is also displayed, there is no details for now of the sum of events per clients.
Pending Events
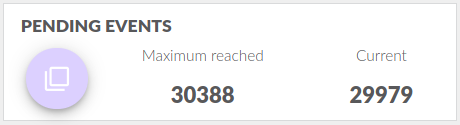
In this tile, the number of psevents sent by dataserver is displayed (the details of psevents is in the dataserver tab). The sum of events consumed by all clients is also displayed, there is no details for now of the sum of events per clients.
If the value “-1” is displayed then check dataserver logs, it means that database returns an error, this value is directly read from Calypso API.
Stalled requests
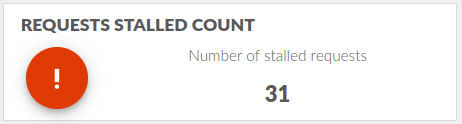
A stall request is a request than running during more than an expected duration (by default 30 seconds).
This tile display the number of stalled requests during the selected period. You can have details on the requests by clicking on the icons.
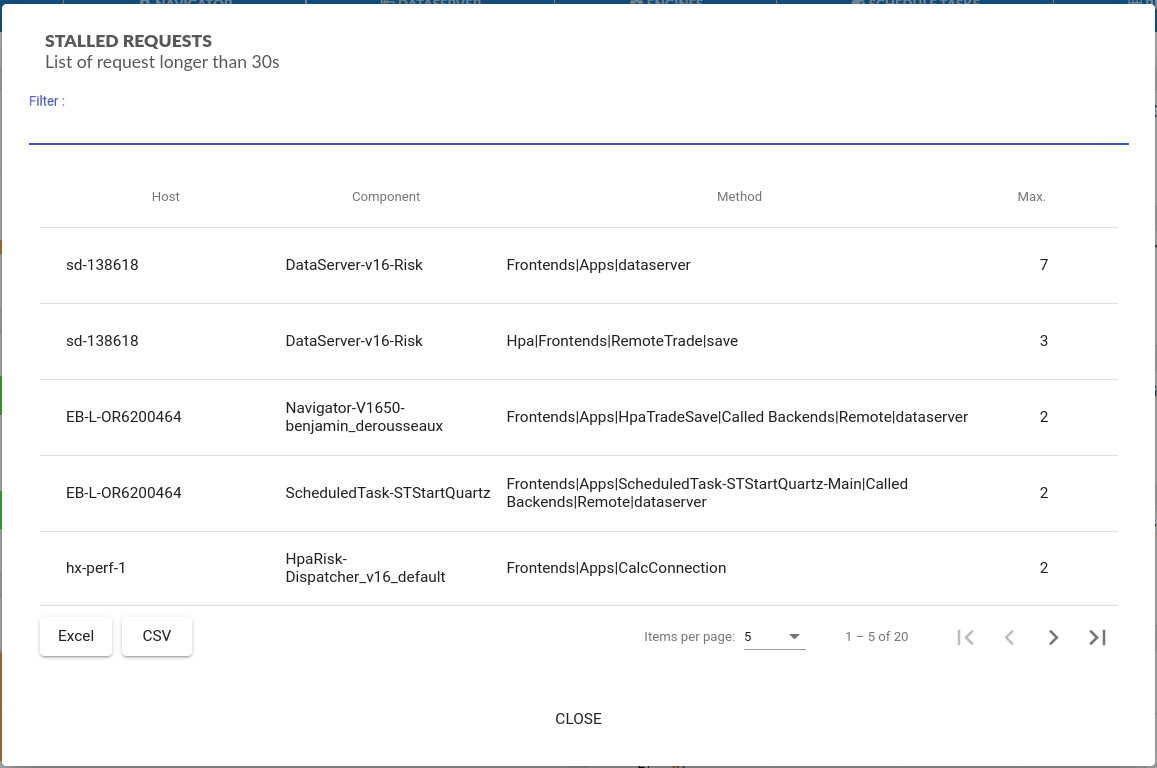
The detailed dialog shows multiple information about where the long response time has been detected. Entries in this dialog are not linked together but entry points and output points of components can be in stall together if relative to each other.
Objects volume
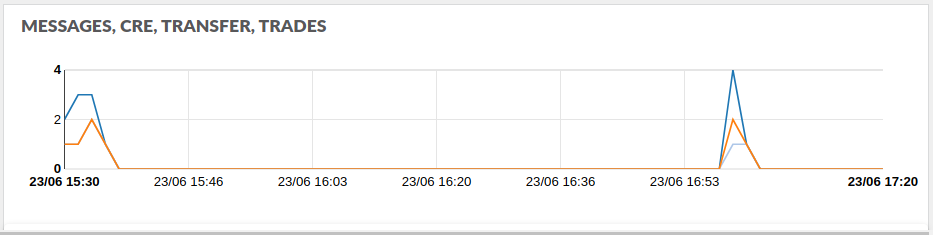
This graph shows the number of modified objects (i.e objects saved in database) in the dataserver :
- Trade
- Message
- CRE
- Transfer
- Posting
The objects that have not been inserted/updated in database are displayed in the top right corner.