Availability
This page display information from an optional component: the database plugin.
This optional extension from the APMIA/Infrastructure can be activated (only if APMIA/Infrastrcture is also activated)
See installation part : Database extension installation
Metrics
Most of those metrics are quire usual Oracle metrics - some explanations are shared for the others:
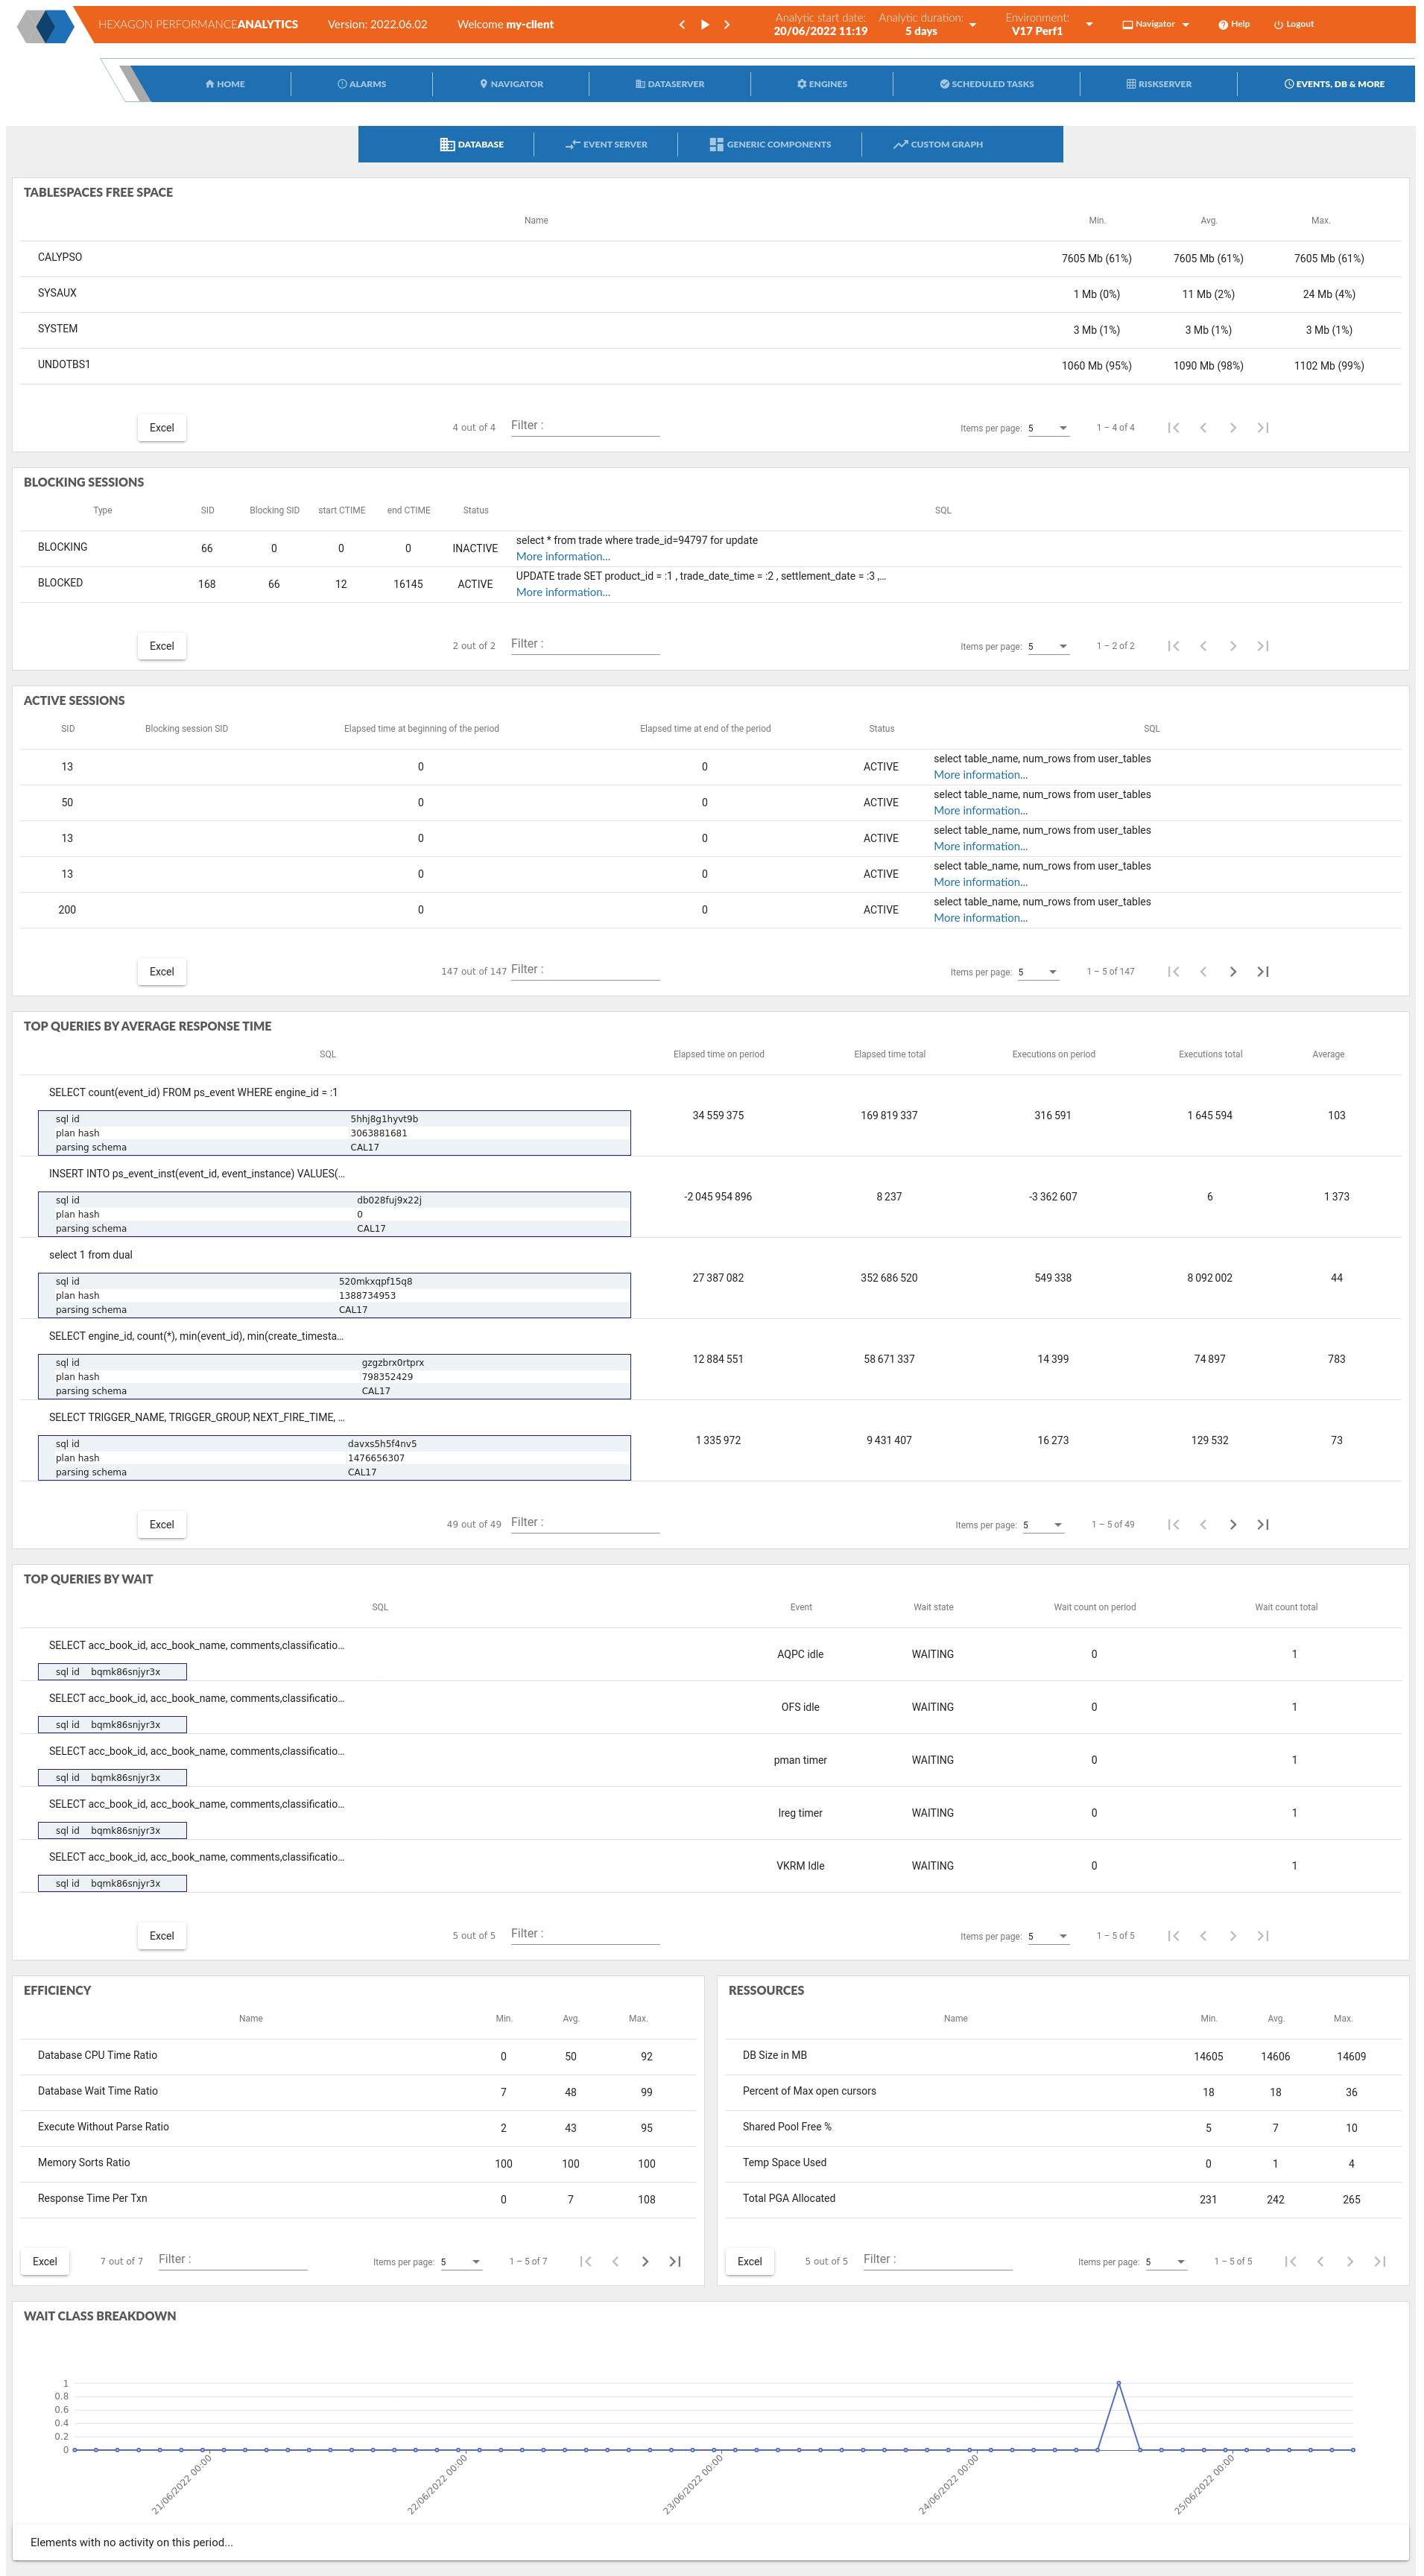
Efficiency
Database CPU Time Ratio
Measures what fraction of the database’s active time is productive CPU work. A well-tuned OLTP system typically shows 80%+. If it drops, waits are taking over. Combine with the wait class breakdown to understand why. Note: a very high value (near 100%) on a busy system can also indicate excessive hard parsing or full-table scans — high CPU can itself be a symptom.
Database Wait Time Ratio
The exact complement of the CPU ratio (both sum to 100%). It quantifies the overhead from all non-idle
Soft Parse Ratio
Focuses specifically on the parsing step. A hard parse means Oracle found no usable cursor in the shared pool and had to fully parse, optimise and generate an execution plan. A soft parse means a matching cursor was found (same text + same environment). Hard parses hold the library cache latch, causing scalability issues under high concurrency. The fix is almost always bind variables; CURSOR_SHARING = FORCE is a last-resort workaround. Note the difference with the Execute Without Parse ratio: here we count all parse calls, whereas EWP measures executions that avoided parsing altogether.
Wait Class Breakdown
Oracle groups every wait event into a wait class (User I/O, Concurrency, System I/O, Network, Commit, Application, Scheduler, Administrative, etc.). In a monitoring session, looking at which class dominates immediately tells you where the bottleneck is: heavy User I/O → disk reads, high Concurrency → latch or lock contention, high Commit → redo log write latency. This breakdown is the first thing to examine in AWR or OEM before diving into individual events.