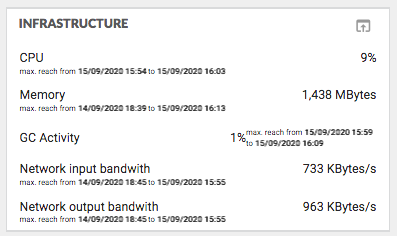
This block gives information on the JVM infrastructure metrics :
- CPU
- Memory
- Garbage collection
- Network bandwith
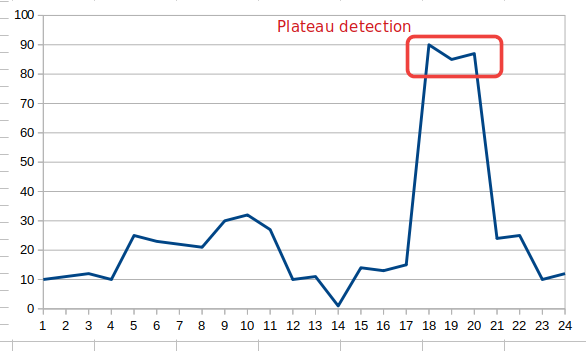
For each one of these infrastructure metrics, the displayed value corresponds to the highest plateau reached on the monitored period. Information about the dates when this plateau was reached is provided bellow each metric name.
In details :
-
CPU: It is the percentage of the total computing power of the host, but limited to the percentage utilized by the monitored JVM.
-
Memory: it records the memory usage (byte in use and byte total).
-
Garbage Collection (GC):
it records the percentage of time spent in GC during the last 15 minutes. If JVM stays in garbage collection, it can not handle its requests. It is often a sizing or usage anomaly when the GC value is too high. -
Network bandwidth: it is the number of Bytes per seconds recorded on the sockets used in the program. In HPA portal, this is the highest plateau for the sum of all sockets bandwith which is displayed. In a word, the maximum bandwith use by the JVM process.
-
Open file descriptors (Unix only):
the highest plateau of open file descriptors held by the JVM during the selected period (Hpa|Infrastructure|Unix:openFileDescriptorCount). Useful to detect file descriptor leaks before the OS limit is reached. -
Free memory swap size :
the lowest plateau of free swap space during the selected period (Hpa|Infrastructure|SwapSize:free). Displays the minimum reach — a low or zero value indicates memory pressure and potential swap exhaustion.
On all these metrics, HPA portal displays the highest plateau for the selected period, except Free memory swap which shows the lowest plateau. It analyzes the graph for each metrics and computes the maximum (or minimum) usage.