To follow the dataserver activity, we record dataserver APIs calls, the idea here is to represent the volume and response time of those API Calls.
Dataserver compute time
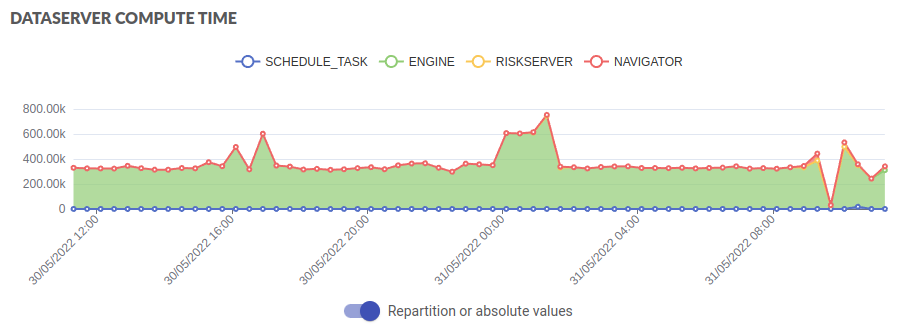
The graph represents the volume of milliseconds of treatment done by the dataserver per interval, splitted by client type.
This graph details by group of client which group is using the dataserver resources. It is possible because HPA agent inject on the API calls an identifier, examples :
- “I’m a navigator connected with user JohnTurtle”
- “I’m an engine called LiquidationEngine”
- “I’m a scheduled tasks named OT_GOPAR”
This graph shows by group of clients which group consume the API (volume of milliseconds for each requests) :
- Navigators
- Scheduled Tasks
- Engines
- Risk components
- Other generic components
The graph can switch to a repartition view for another type of analysis, see details here.
It is then possible to split the analysis period in sub-period to focus on a specific type of client.
The load displayed in an average load for the given interval. The interval depends of the timerange selected, so a long time range could have a slightly different value that a short time range for the same timestamp.