Once an engine JVM is selected, a set of data is displayed under the select box.
The blocks are always the same, but some can be empty depending on engine JVM activity.
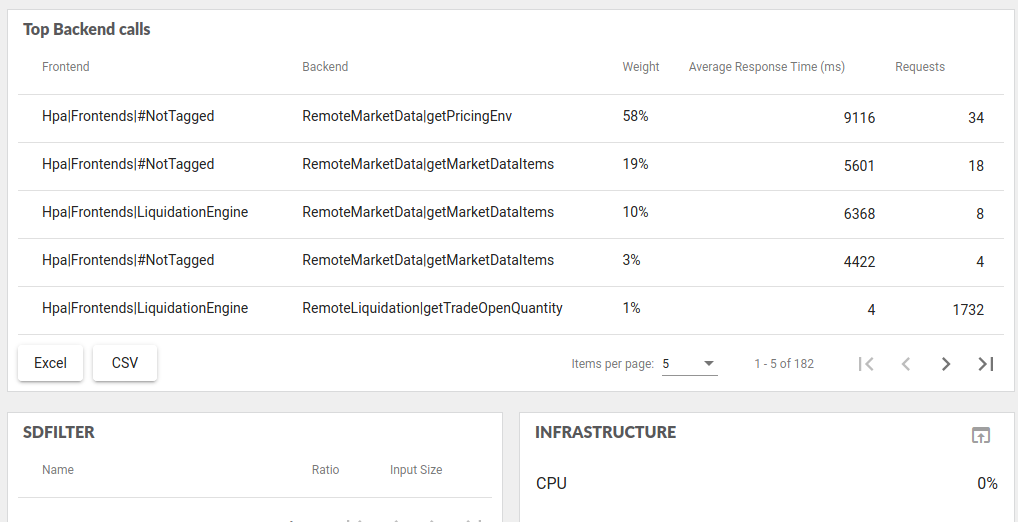
- Backends / Output points
- PS Events
- SD Filter
- Infrastructure
- Resources summary
- Trade Array Size
- Method hotspots
- Cache usage
A lot of these blocks are identical for the different sheets.
Example of detailed engines’ activity: