Usage
On a regular basis, threads dumps are executed. For each thread, we capture:
- the state
- the stack trace
- the caller (only valid for DS methods hotspots)
- the lock id (if any)
Over the selected period of time, information is aggregated.
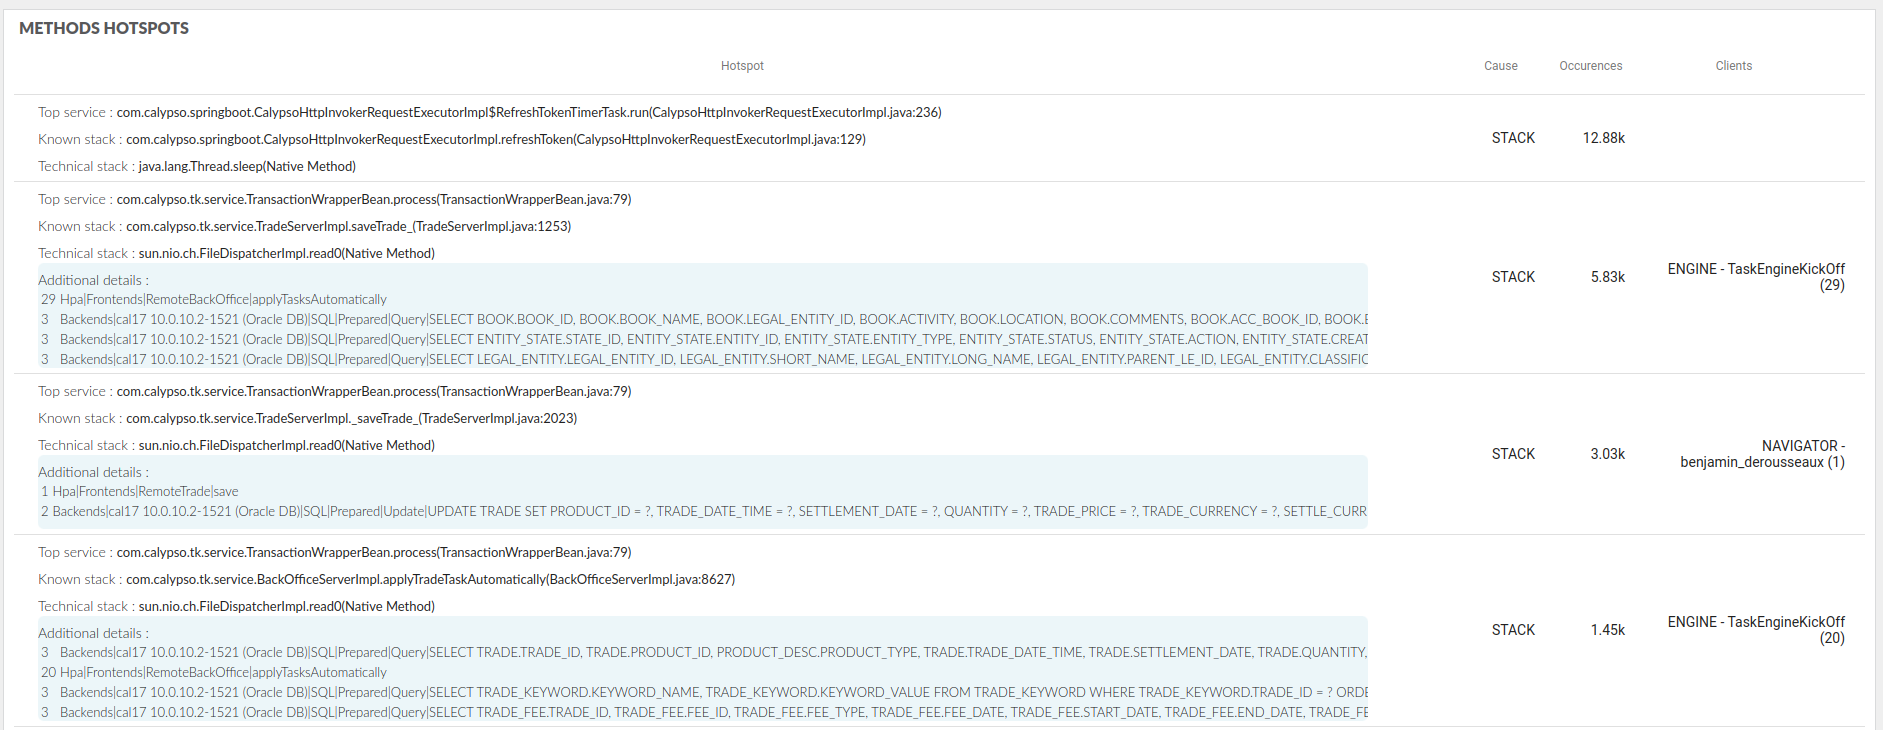
Hotspot Stack trace usage:
- Top service: the first call in the calls hierarchy containing a relevant package (e.g. com.calypso)
- Known stack: last call in the calls hierarchy containing a relevant package (e.g. com.calypso)
- Technical stack: last stack call
- additional details: in this field are described the entry/output points recorded for this stack
- entry points are identified by “Frontends”, output points by “Backends”
- Digit: number of times this entry/output points have been recorded in the threads dumps
- text: description of the entry/output points
- this field can be extended by moving the mouse over
- this field is present expanded in the exported files
Cause
- State of the thread
- STACK value is the standard one
- BLOCKED or BLOCKER
Occurences Number of times this stack is appearing in all the threads dumps over the selected period of time.
Clients
- DS client calling the Top service
In this example, the stack is analyzed like this :
- the technical stack is line 5
- the first known stack is line 17: the first calypso method
- the top level service is line 87
 1. "SwingWorker-pool-791894282-thread-6" #212 prio=5 os_prio=0 tid=0x00007f1a49cb3000 nid=0x394e in Object.wait() [0x00007f1aa6685000]
 2.   java.lang.Thread.State: WAITING (on object monitor)
 3.      at java.lang.Object.wait(Native Method)
 4.      at java.lang.Object.wait(Object.java:502)
 5.        at org.jboss.ejb.client.EJBClientInvocationContext.awaitResponse(EJBClientInvocationContext.java:413)
...
17.        at com.calypso.tk.service.LocalCacheClient.getCurrencyPair(LocalCacheClient.java:1638)
18.        at com.calypso.tk.service.LocalCache.getCurrencyPair(LocalCache.java:742)
...
50.        at java.io.ObjectInputStream.readObject(ObjectInputStream.java:465)
51.        at java.io.ObjectInputStream.readObject(ObjectInputStream.java:423)
52.        at com.calypso.tk.util.SerialUtil.readObject(SerialUtil.java:209)
53.        at com.calypso.tk.util.GZIPCompression.uncompressObject(GZIPCompression.java:76)
54.        at com.calypso.tk.util.Compression.uncompressObject(Compression.java:183)
55.        at com.calypso.tk.util.SerialUtil._bytes2object(SerialUtil.java:235)
56.        at com.calypso.tk.util.SerialUtil.bytes2object(SerialUtil.java:183)
...
87         at com.calypso.tk.marketdata.PricingEnv.loadPE(PricingEnv.java:1489)
Hotspots in details
To configure threads dumps, please refer to HpaThreadStackService properties (e.g. IntroscopeAgent_dataserver.profile)
hpa.service.startup.HpaThreadStackService=true or false
hpa.service.frequency.HpaThreadStackService=600000
(10 minutes by default)
The dump is parsed, filtered (based on configuration file), all stacks that are not interesting (wait, idle…) are removed.
All this information is saved in a database that belong to HPA extractor