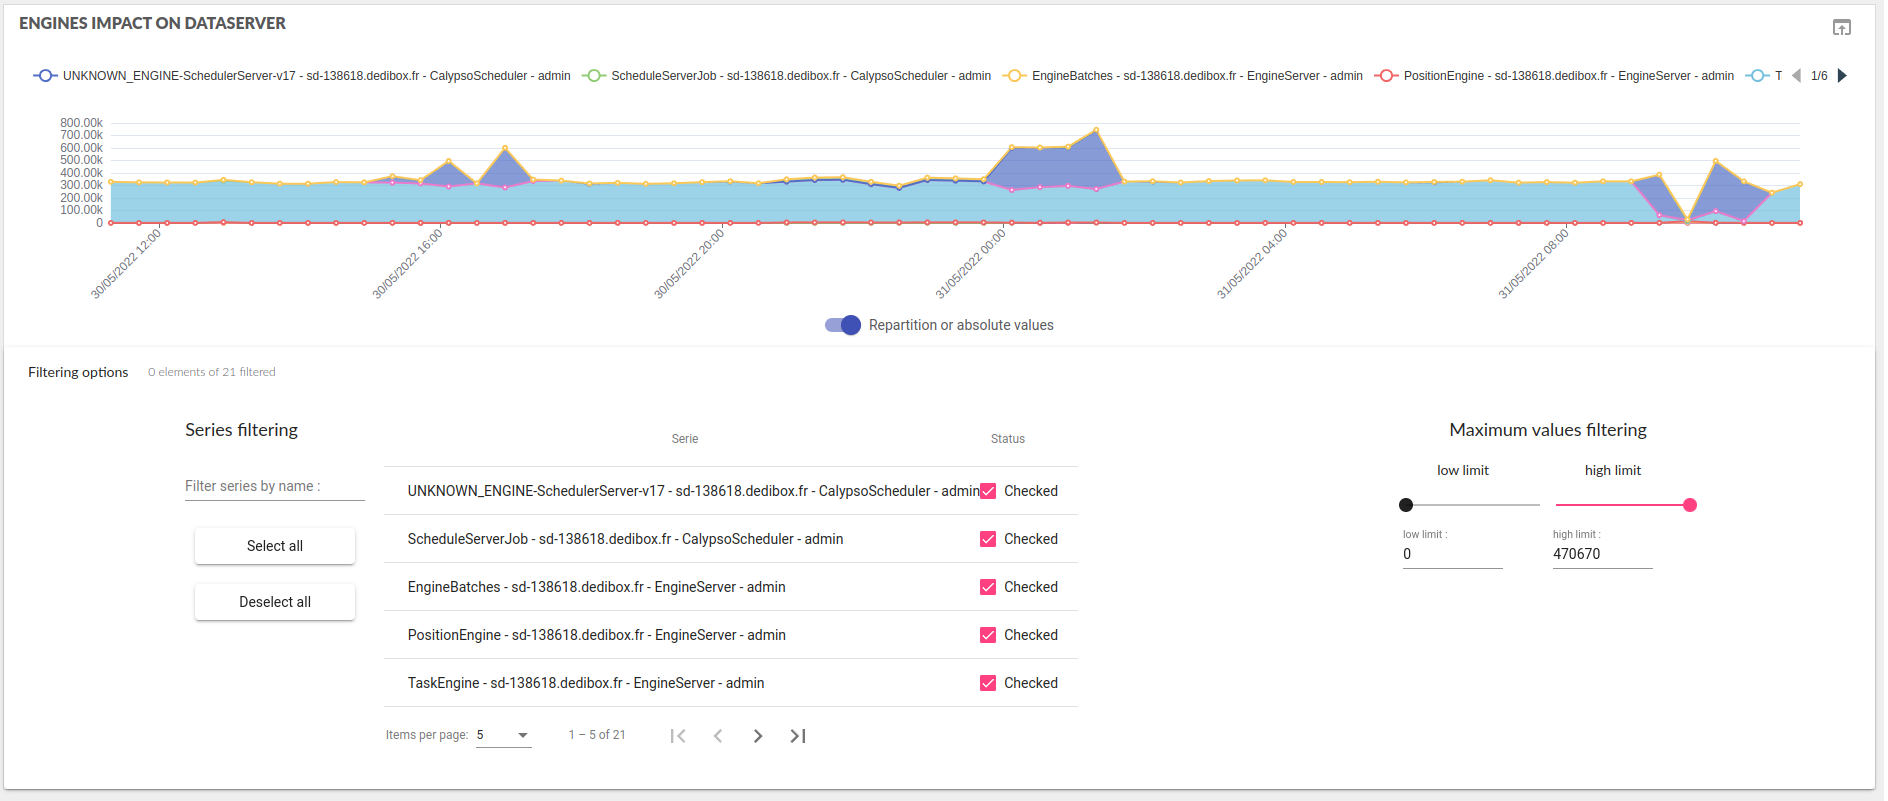
Impact on dataserver by compute time

The graph represents the volume of milliseconds of treatment done by the dataserver per interval, splitted by client type or subtype.
The same component is used for each type of client but is splitted differently :
- homepage : split by global (Navigator, Engines, ScheduledTask, Risk)
- navigator dashboard split by user (admin, robert, jane, …)
- engine dashboard split by engine (liquidation, message, …)
- scheduled tasks dashboard split by ST
- risk component does not have this view yet
This graph details by group of client which group is using the dataserver resources. It is possible because HPA agent inject on the API calls an identifier, examples :
- “I’m a navigator connected with user JohnTurtle”
- “I’m an engine called LiquidationEngine”
- “I’m a scheduled tasks named OT_GOPAR”
It is then possible to split the analysis period in sub-period to focus on a specific type of client.
The load displayed in an average load for the given interval. The interval depends of the timerange selected, so a long time range could have a slightly different value that a short time range for the same timestamp.
Filtering options
For some components or period, it can have a lot of clients connected to dataserver. To help the analysis the portal offers a set of filters :
- Filter by series : check or uncheck series you want to see
- Filter by values : you can focus on the biggest consumers if needed
Impact on dataserver activity by repartition

You can switch to repartition mode by clicking on the toggle button : Repartition or absolute values
To help reading the dataserver compute time, we introduce a repartition graph of the dataserver’s clients.
This is a percentage graph, it splits the activity between the different groups. It should be read with indexes in mind : a group can take 100% of dataserver usage if it is the only one that use the dataserver.
This graph is introduced to highlight the top consumers, on low activity period it’s still display a 100% usage for a single user.
It is then possible to split the analysis period in sub-period to focus on a specific type of client.
The principle to follow is to analyze per usage the audited period. In the previous example we can perform a 1st analysis on the navigator at the beginning of the period. And a second analysis on the engines at the end of the period.