For RUM / Calypso Web UI please refer here
Users overview
To analyze the engines activity, this section helps you to identify engine’s activity.
The very first graph is the dataserver activity for the engines group of client. We displayed here the activity per engines. It permits to identify which client consumes dataserver ressources.
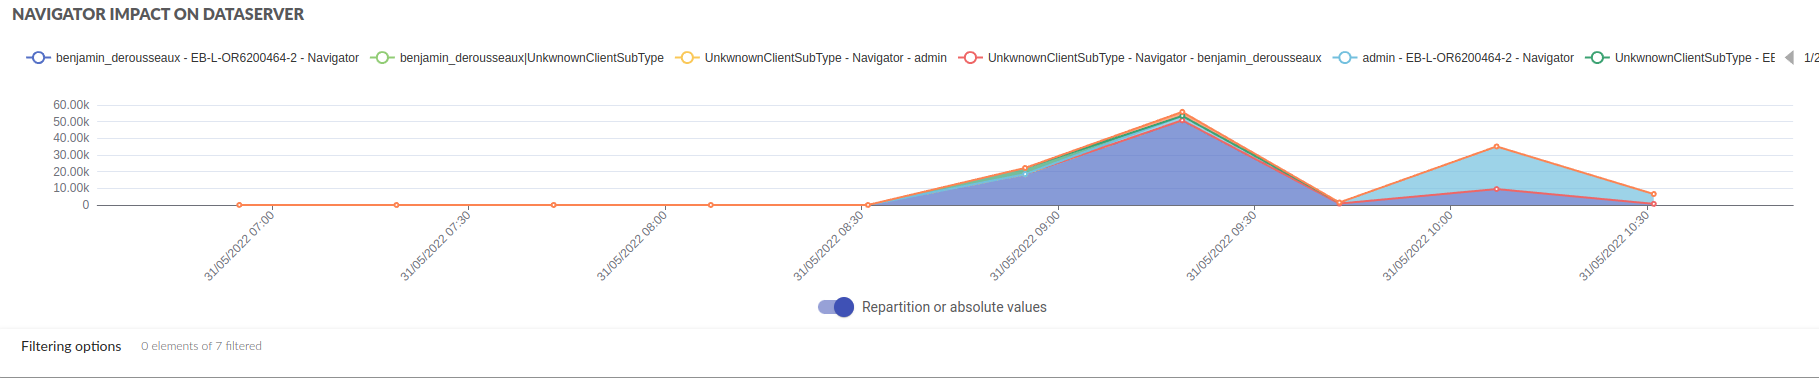
This component is described here
Navigators with low activity
Just under the graph, an expansion panel with title “Elements with low activity on this period…” displays the list of Navigators that have run during this period of time, but whose EJB calls to dataServer duration is too low to be displayed. A switch in the expansion panel enables to display these Navigators on the usage graph.
Please note EJB calls to dataServer duration is too low if it falls bellow the duration between two points of the graph, and that the duration between two points of the graph is the duration of the monitored period divided by 60 (the total number of points of the graph)
Detailed information
Just under the graph, a select box allows to select a user to deep dive in this particular JVM et follow its activity.

Then a new section is displayed : Detailed user activity
Multiple agents appearing for the same navigator
- For one host only, for one navigator launched, several agent names can appear in the Navigators Details
Navigator agent name is based on the account used to login to Calypso and the hostname where the navigator is launched
Metrics are associated to one agent - meaning one agent name - only
- Navigator (hostname)
- At the start of the navigator, the user account is not known, but the agent starts collecting metrics
- This “agent name” is typically appearing until the Calypso login window (if exists) appears
- Navigator-login (hostname)
- The “main agent” collecting navigator metrics
- Navigator-login%1 (hostname)
- During the first minutes after a navigator starts, a second connection to the DataServer is detected
- This is a temporary connection
- On the fly, names of the navigator agents can be recycled and renamed if required
- Navigator-login%i (hostname)
- In case several navigators for the same user and the same host are launched, new navigator agent names will appear
- As explained previously, some of those navigator agent names are temporary
- Taking the example of two navigators running on the same host, after a couple of minutes, only two will continue collecting metrics:
- Navigator-login (hostname)
- Navigator-login%1 (hostname)
- Even if during a couple of minutes Navigator-login%2 (hostname) and Navigator-login%3 (hostname) might have exist also