All SQL calls made from the dataserver are recorded and a summary is displayed in this block. HPA Agent records each SQL call and give statistics on it :
- SQL
- Number of calls
- Average response time
- Weight of the SQL in relation all SQL
- Average row count per requests
- Stall count : when request run since more than 30s (1 counter every 30 seconds of execution)
- Average resultSet processing time
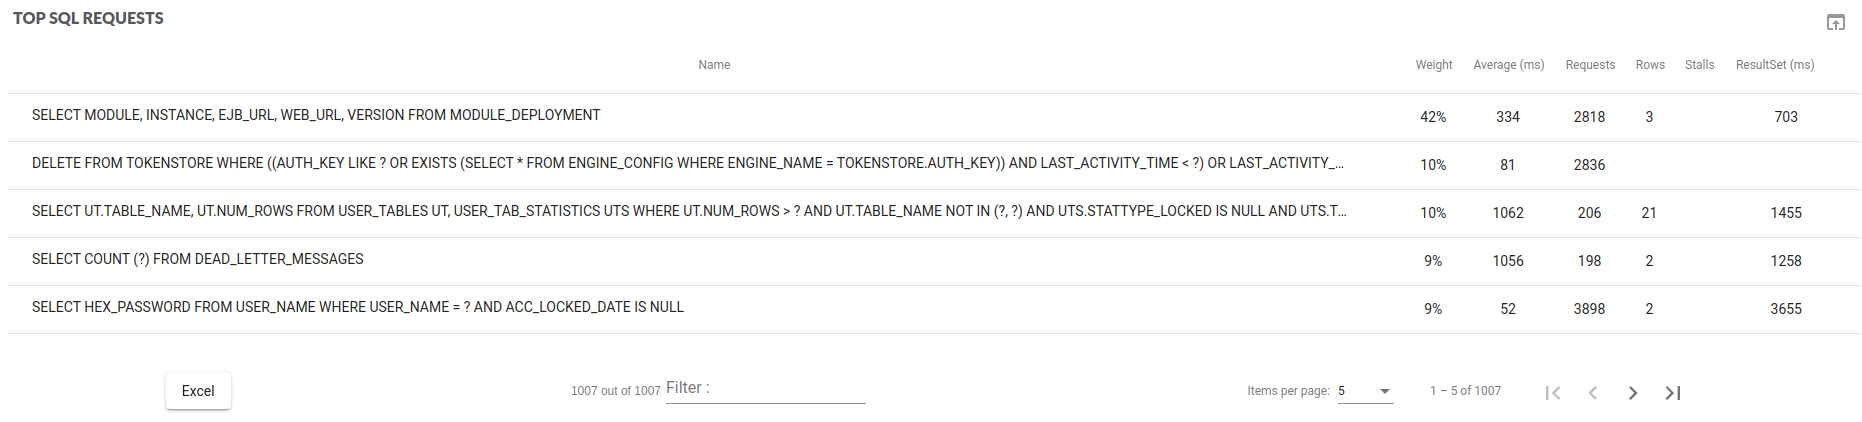
The name of the SQL request is limited to 3000 characters by default. In the portal only the first line is shown but if you put the cursor over the SQL it expands it. In the export, the SQL are fully expanded for all lines.
The link between the frontend/entry point and the SQL request is not recorded to reduce the agent overhead consumption. However, if clicking on the shortcut webview can display some transaction trace for the related SQL. As it is sampled and purge after two weeks it’s not guaranteed, but it can help to solve an issue.
As usual export data functionality is available.
See shortcut to webview data in this paragraph
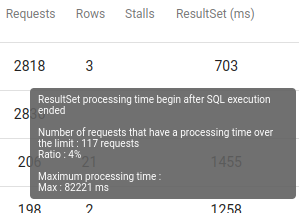
ResultSet processing metric
To avoid a too high number of metrics, by default agent record only the recordSet that are opened longer than 1 second. The very short resultSet won’t be record, this will save a lot of metric and memory.
Take care of this metric, as only the time over a given limit are recorded :
- The average response time is only relevant if most of the requests have a long resultSet processing time
- Check the number of requests
When you pass the mouse over the metric, the additional detailed are shown :
- Ration : number of requests over the limit compare to total number of SQL call
- Max response time : maximum response time for the processing
A different setup can be done for testing purposes by recording all the resultSet processing time, contact support@hexagon-perf.com