Engines overview
To analyze the engines activity, this section helps you to identify engine’s activity.
The very first graph is the dataserver activity for the engines group of client. We displayed here the activity per engines. It permits to identify which client consumes dataserver resources.
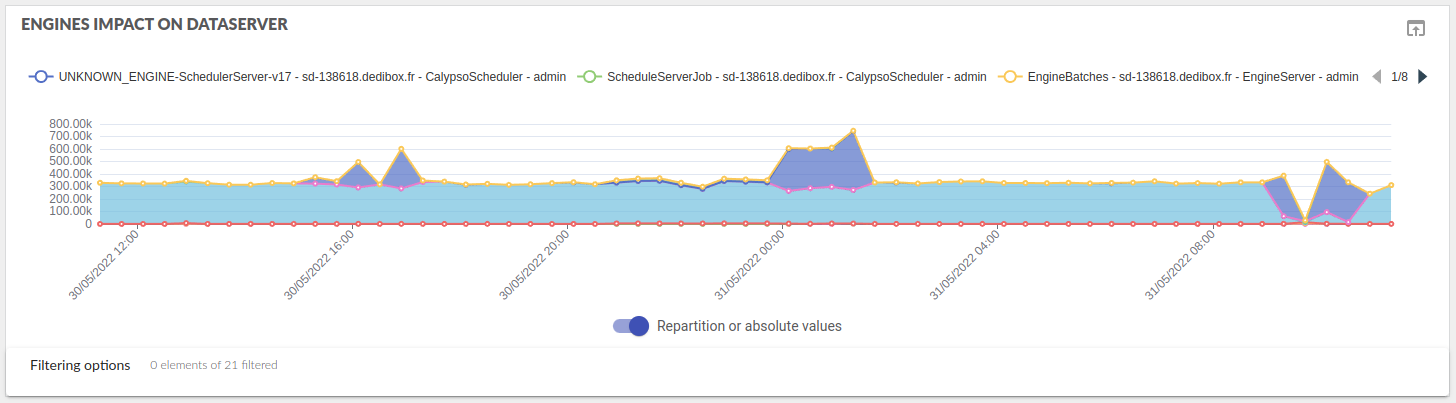
This component is described here
Pending events
A graph of the pending events by engines, this is the pending event stats that is displayed in the administration dataserver.
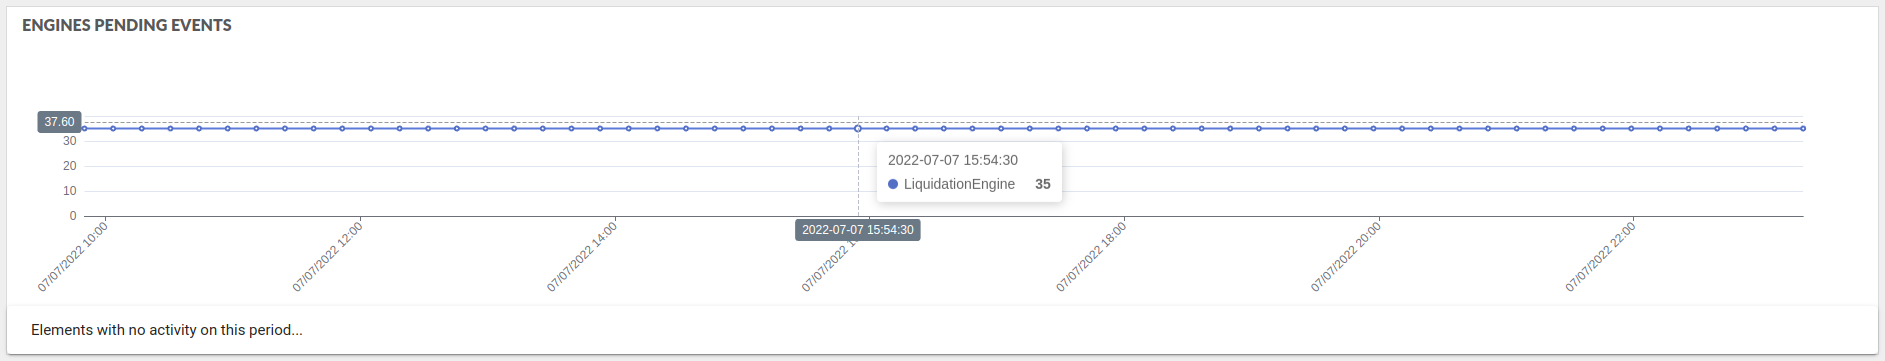
Engines with no activity
Just under the graph, an expansion panel with title “Elements with no activity on this period…” allows to display the engines that have run since the beginning of the monitoring and that have not run during the monitored period of time.
Detailed information
Just under the graph, a select box allows to select an engine JVM to deep dive in this particular JVM et follow his activity. This select box show the engines JVM and not the engine name itself.
Then a new section is displayed : Detailed engine activity
Engines usage statistics
A summary of the engines is displayed after that, it describes :
- the engine name
- a weight of the engine, weight is computed among all engines over all JVM
- the average response time describes the average time to process an event
- requests is the number of processed events (from process event method)
- threads column : number of active threads on maximum threads.
- max of pending events is higher queue size on the period
- bad events is the number of bad events (from engine statistics).
For the pending events and threads metrics, the value is the maximum reached on the period.
This summary is based on JMX metrics detailed in Calypso Engine Server and Engine metrics.
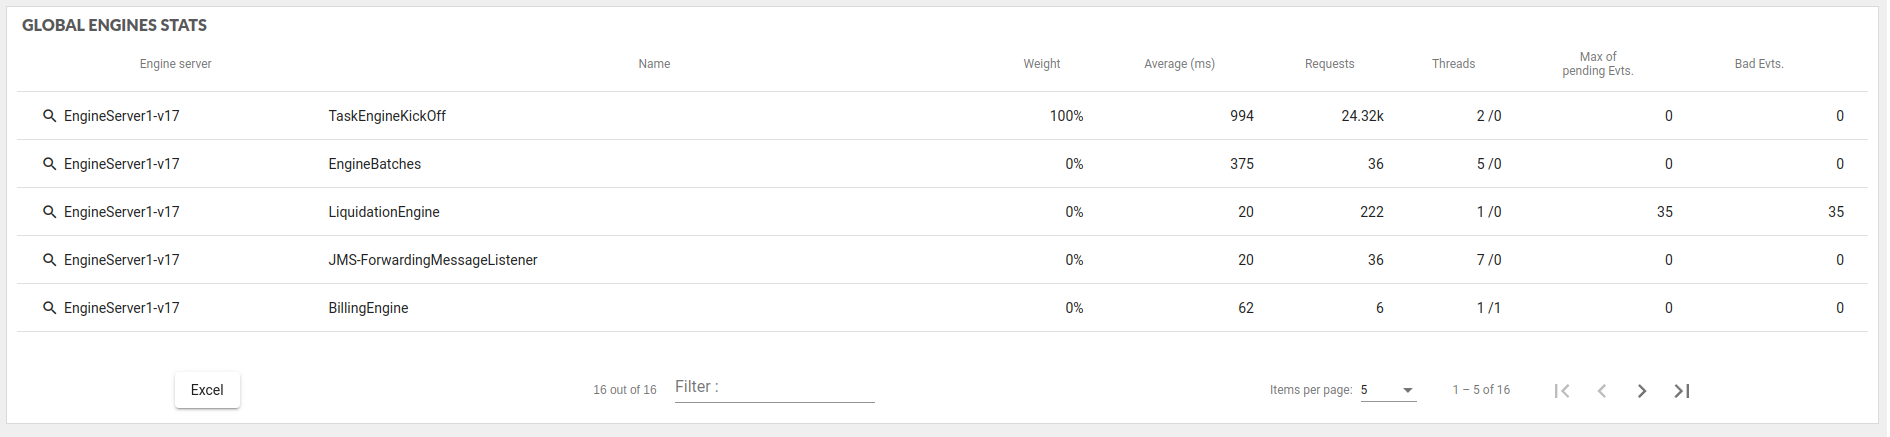
You can click on the icon on the beginning of the line to automatically select the corresponding engine server.
You can find more details about engines metrics here.