Here you can find a summary on the alerts generated by HPA over the time period. Resolved alerts have an OK status.
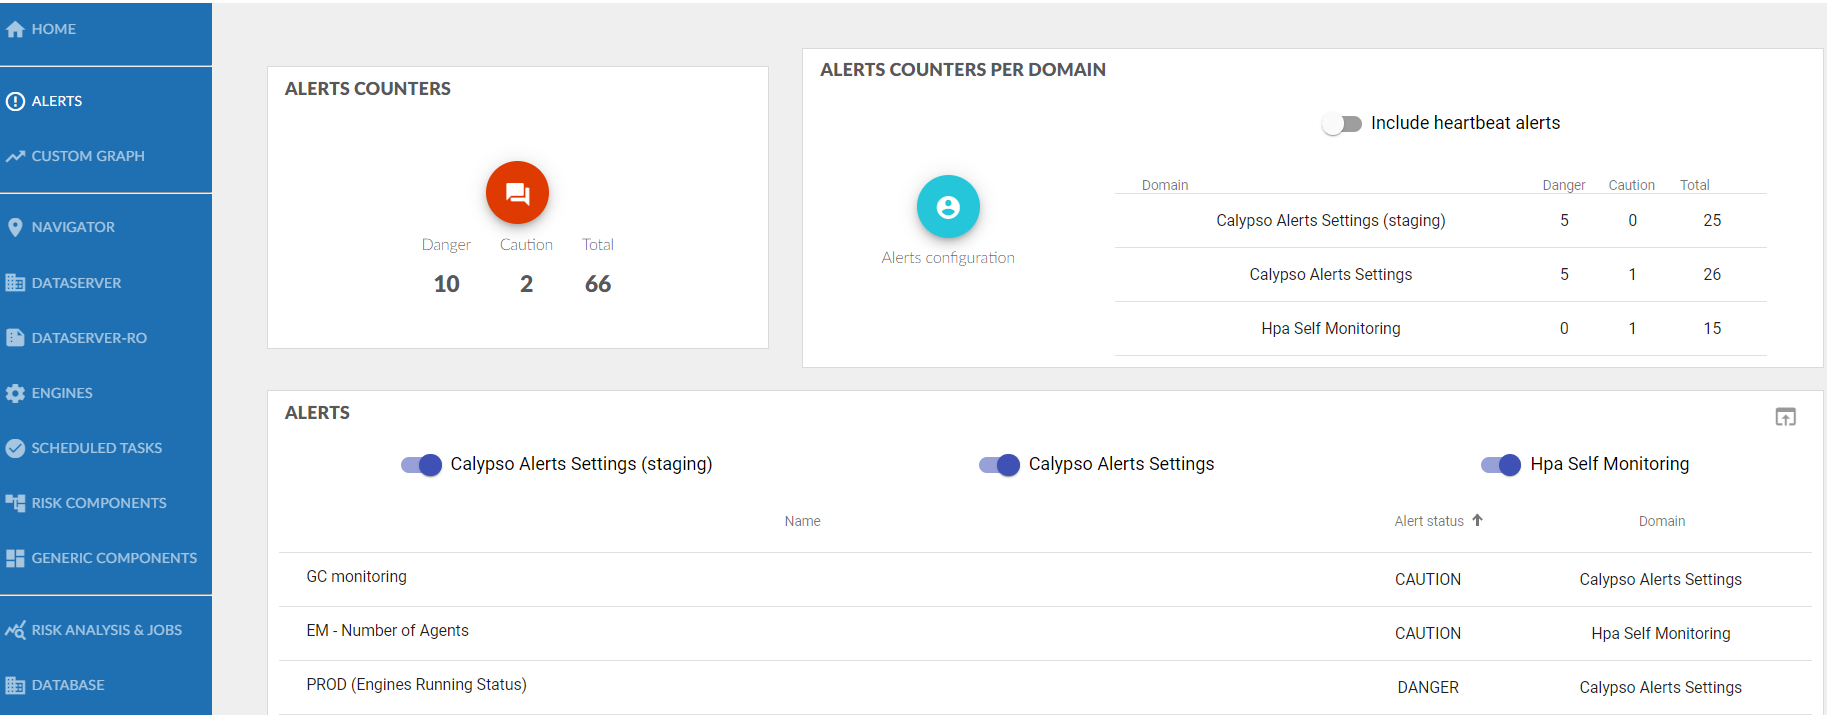
“Alerts” tile
| Column | Description |
|---|---|
 |
Shortcut to a custom graph showing both: - the internal metric of the alert status (1=OK, 2=Caution, 3=Danger) - the underlying metric (AVG, MIN and MAX values) as defined in the metric grouping Note: Summary alerts are not handled for now. |
| Domain | Name of the Management module in which the alert was created. |
| Last occurrence | Last time the alert was triggered during the selected date range. |
| Name | Name of the alert. |
| Alert status | Last status of the alert (CAUTION, DANGER or OK). Based on the thresholds set on the alert definition. |
 |
Link to the actual alert definition in the webview. |