HPA collects several metrics used to monitor the platform itself.
No dedicated screen in the portal except the view on status of alerts based on self monitoring metrics and potential saved custom graphs.
UI access to metrics
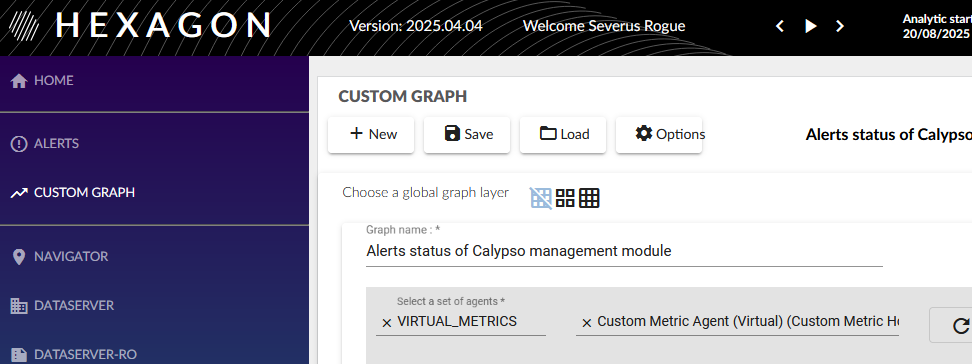
Custom graph
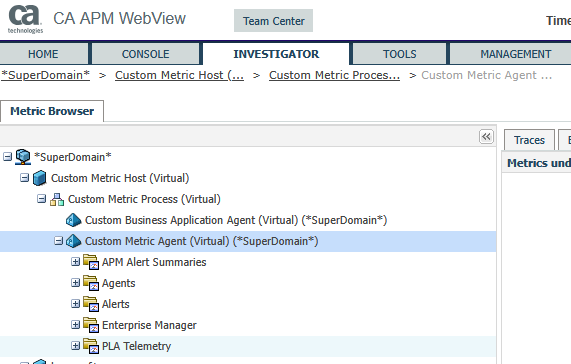
WebView
Some metrics used to monitor HPA health
Most of those metrics are linked to default alerts provided by HPA in the Hpa Self Monitoring management module.
| Metric | Comment |
|---|---|
| Agents|(.*):ConnectionStatus | Captures the connection status between the agent and the EM - value 1 means “connected” - value 3 means the agent has stopped sending metrics for a couple of minutes - no other values By building when an agent is not connected, this metric is not captured, then lack of data |
| Agents|(.*):Is Clamped | Captures the metrics number not saved because of EM maximum number of metrics reached |
| Agents|(.*):Metric Count | Captures the number of metrics per agent Each agent profile is defining a max different metric collected between each agent restart Beyond this number, new metrics are not more saved |
| Enterprise Manager|Connections:Number of Agents | Captures the number of agents connected to the collector By default the maximum number of agents supported is 500 |
| SystemEdge | Relative to the metrics captured by the infrastructure agent |