JMX metrics
Each engine belonging to an engine server has a set of JMX metrics captured by the agent of the EngineServer.
- The metric name pattern is
Frontends|Apps|Hap-Engine-Engine name|JMX metric name. - One example
Frontends|Apps|HpaEngine-TransferEngine:JMX BadEventsCount
| JMX metrics | Comment |
|---|---|
| JMX BadEventsCount | Number of bad events during the selected time period - reset at each start |
| JMX ConsumedCount | Number of events during the selected time period + reset at each start |
| JMX TotalUnconsumedCount | Number of unconsumed events |
| JMX EngineThreadCount | Number of threads for the engine - coming from engine configuration - 0 if not defined |
| JMX Event PoolSize | Event pool size |
| JMX DBEventLoadCount | Number of events during the selected time period |
| JMX Suspended | Suspended status of the engine ; 1 if suspended |
Other metrics - same pattern than JMX
| Metrics | Comment |
|---|---|
| Concurrent Invocations | Max number of tries to execute threads in parallel - then different than JMX EngineThreadCount |
| Average Response Time (ms) | Average response time of the process method of the engine |
| Total Backends Time | Time dedicated to call the backends of the engine, mostly the DataServer |
| Total Server Time | Time spent by the DataServer to answer ; backends - server time = network + serialization ; this is not always provided by the DataServer |
| Total Transaction Time | To not consider for engines |
| Inner time (portail only) | Difference between response time and backends time |
| TimeSinceLastConsumedInMs | Time elapsed since the last consumed event for a given engine (in milliseconds) |
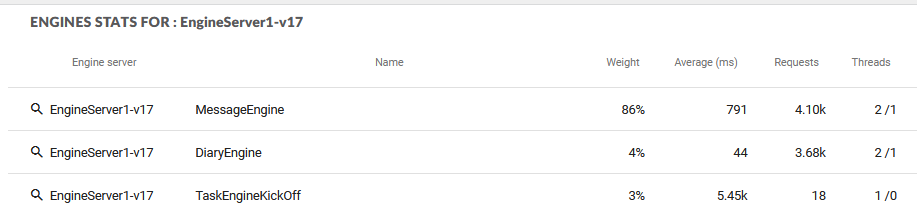
In the portal the threads information is aggregated: Concurrent Invocations/JMX EngineThreadCount
Automatic running status
The state of each engine marked as having an automated start is monitored.
Those metrics are captured by the agent of the DataServer RW.
-
The metric name pattern is
Hpa|EngineStatus|engineserver|Engine name|Automatic:running Status. -
One example
SuperDomain|hex-perf1|v17|DataServer|Hpa|EngineStatus|engineserver|InventoryEngine|Automatic:running Status -
If the engine is started, the metric value is 1
-
If the engine is stopped, the metric value is 0
-
Those metrics are captured every 5 minutes.
UndecodePSEvent
Depending the previous state of an engine, and depending the quality of the PSEvents in their queue, a specific method can be called by Calypso:
-
com.calypso.engine.BatchThread.UndecodePSEventCallable.call() - metrics are recorded as
Frontends\|Apps\|HpaEngine-.*UndecodePSEvent.*
This method is especially used when engine is dealing with future bad events.