- Description
- Information captured
- Create a context tracer on stall
- Create a context tracer on every call
- Configure the data collected
- Configure the data displayed in the portal
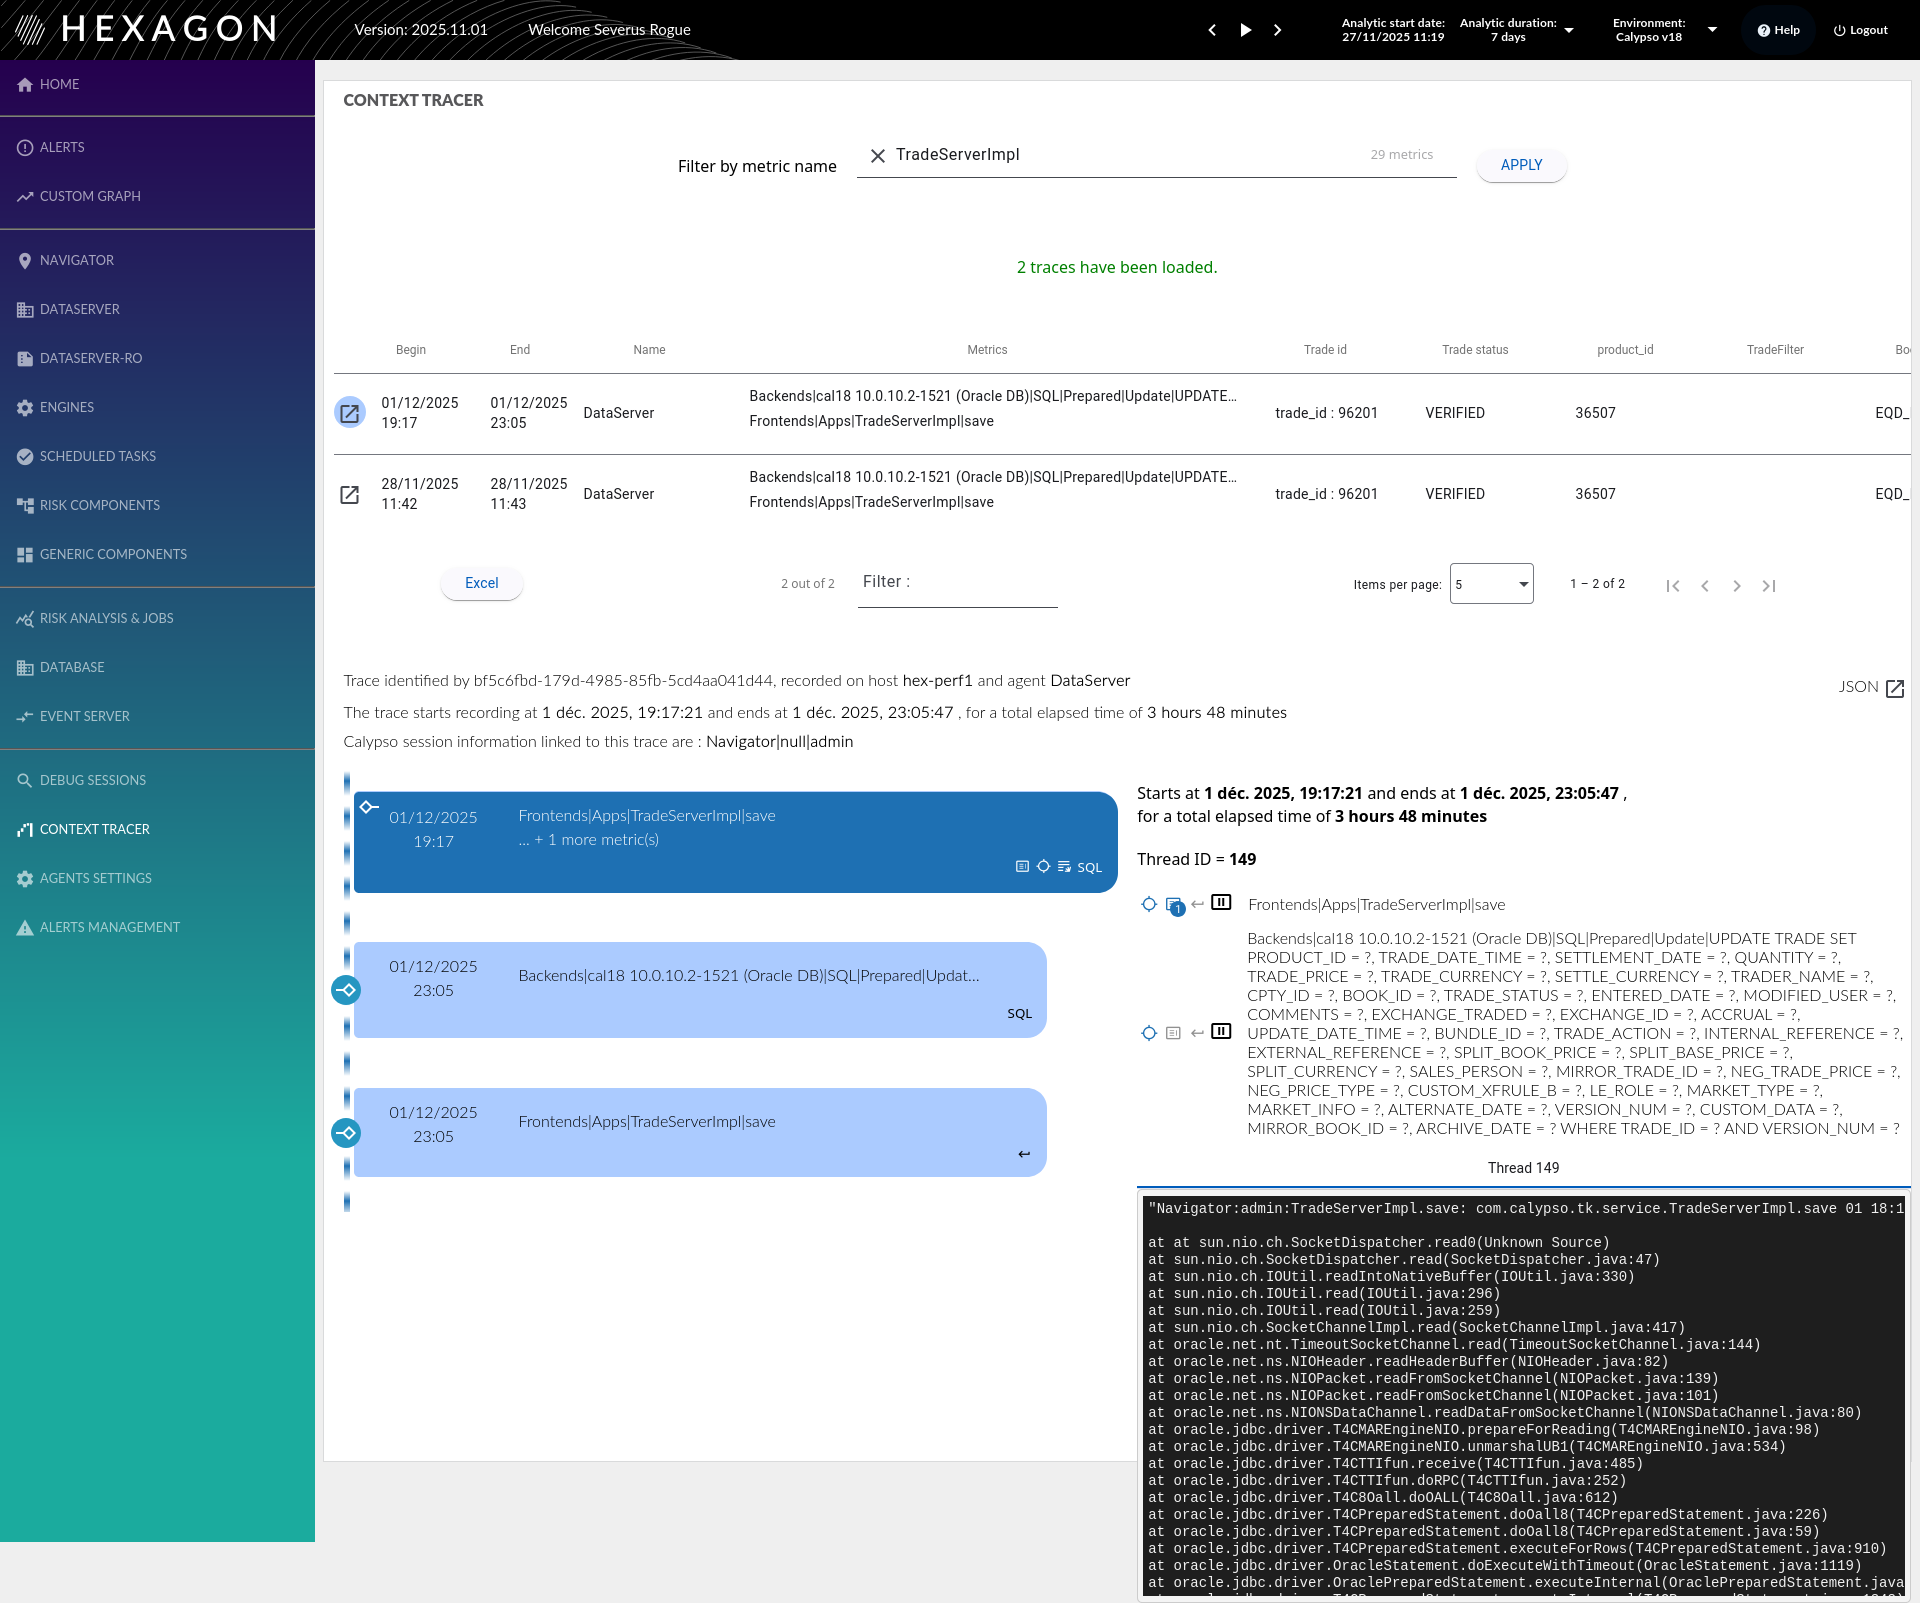
- Screenshot
Description
To help troubleshooting analysis, HPA provides detailed information context named Context Tracer in two cases:
- on some specific request executions, configured by a limit of execution time (stall), in agent configuration
- for all executions of a specific request, configured with a specific custom metric declaration using the dedicated
HpaDumpParamTracer- but no new metric captured
Information captured
In both cases, HPA captures and records:
- the object that execute the method metric
- the parameters of the method metric
- the return value of the method metric
- the HPA metric(s) involved
When a context tracer execution comes from a stall, then HPA captures also:
- the stacktrace
- the thread information
- start/end/elapsed time of the execution
- calypso session information when available
- the stall indicator: is the method execution time is over the configurable threshold
see the screenshots for an overview
Create a context tracer
Context tracer on stall records a stall metric AND a context tracer.
Context tracer on stall
To record a Context Tracer on a long execution time, configure the agent with
-
override_config/configuration_stall.yml
This file describes the metrics to record:
- either by giving the metric name
- or by using a regular expression
Then, in the same block:
- set a execution time limit
- set the action to do:
-
NOTHINGto ignore the stall (can be useful to clean the data recorded) -
METRICto capture the stall metric only -
METRIC_AND_CONTEXTto capture both the stall metric and the related context tracer
-
- set the metric(s) filter
-
DIRECT_VALUEto use the full metric name -
REGEXPto select multiple metrics at once
-
- set an optional agent filter (since version 5.0):
-
agent-regexpto apply the action only to specific agents matching a regular expression pattern - if not defined or empty: action applies to ALL agents
- examples:
"ScheduledTask-.*","(prod|uat)-.*","DataServer-01"
-
The combination action-stall duration-filter defines a perimeter for which the HPA expected behavior is defined.
There is also a default action with a default time execution limit.
The minimal acceptable stall duration is 15 seconds.
When using a REGEXP filter, the | character must be escaped in metric patterns, for example: Hpa\|RiskAnalysis\|Analysis\|.*
actions-on-stall:
  default-action:
    action: METRIC_AND_CONTEXT
    stall-duration-in-seconds: 30
    # agent-regexp: ".*"  # Optional: applies to all agents by default
  custom-actions:
    - action: NOTHING
      stall-duration-in-seconds: 60
      filter: DIRECT_VALUE
      metrics:
        - Frontends|Apps|TimerThread
    - action: METRIC
      stall-duration-in-seconds: 180
      filter: REGEXP
      metrics:
        - .*PThread.*
      agent-regexp: "ScheduledTask-.*"  # Only for ScheduledTask agents
    - action: METRIC_AND_CONTEXT
      stall-duration-in-seconds: 15
      filter: REGEXP
      metrics:
        - Hpa\|RiskAnalysis\|Analysis\|.*  # Regex metric: escape pipe characters
Context tracer on every call
This use case is used to record all the calls made on a method, for example:
- record all bad events on engines
- record all report parameters on navigators
Follow the steps to enable it :
- create a custom metric
- with the following definition :
#
# Context tracer on <com.calypsox....mypackage.MyClass>.<myMethod>
#
SetFlag: CustomerCTNewFlag
TurnOn: CustomerCTNewFlag

IdentifyClassAs: <com.calypsox....mypackage.MyClass> CustomerCTNewFlag

TraceOneMethodWithParametersIfFlagged: CustomerCTNewFlag <myMethod> HpaDumpParamTracer "CustomerCTNewFlag"
The class <com.calypsox....mypackage.MyClass> is monitored on the method <myMethod>. Each time the method is executed
the context tracer will record the usual information.
Configure collected data
When the context tracer is triggered, it records many objects information.
The way those objects information are captured is described in default_config/configuration_context_tracer.yml
To avoid/limit the overhead, there are 2 available configuration
- a limit of the number of context tracer recorded by the agent:
maximum-trace-sent-every-15s - a limit when HPA detects collections :
maximum-elements-to-get-in-collections- When a parameter or return value is a list, it records only X elements in the list.
- The limit can be overridden for some properties by adding
̀max-element-in-collectionproperty
There is already a list of objects that are recorded in details, to modify this list and/or the above limites, configure the agent in
-
override_config/configuration_context_tracer.yml
It overrides the default file, so keep the actual configuration if needed in the override file.
maximum-trace-sent-every-15s: 50
maximum-elements-to-get-in-collections: 2
conversions:
  "com.calypso.tk.bo.BOCre":
    - property: "getId"
      converter: METHOD
    - property: "getStatus"
      converter: METHOD
    - property: "getCreType"
      converter: METHOD
  "com.calypso.tk.util.InventorySecurityPositionArray":
    - property: "firstElement"
      converter: METHOD
    - property: "lastElement"
      converter: METHOD
    - property: "size"
      converter: METHOD
  "com.calypso.tk.core.Attributes":
    - property: "hashtable"
      converter: METHOD
      max-element-in-collection: 5000
  ...
  ...
The following converters are available
| Converter value | Behaviour |
|---|---|
| METHOD | calls the method (public) of the object - assuming no parameter |
| ATTRIBUTE | gets the value of the attribute - valid for public/protected/private |
| CUSTOM | enables a converter with a more complex behviour - eg for legal entities where a specific attribute can be captured based on his name |
| CONTEXT | specific for some risks objects |
Other custom converters can be introduced on demand but will require Hexagon support
Configure displayed data
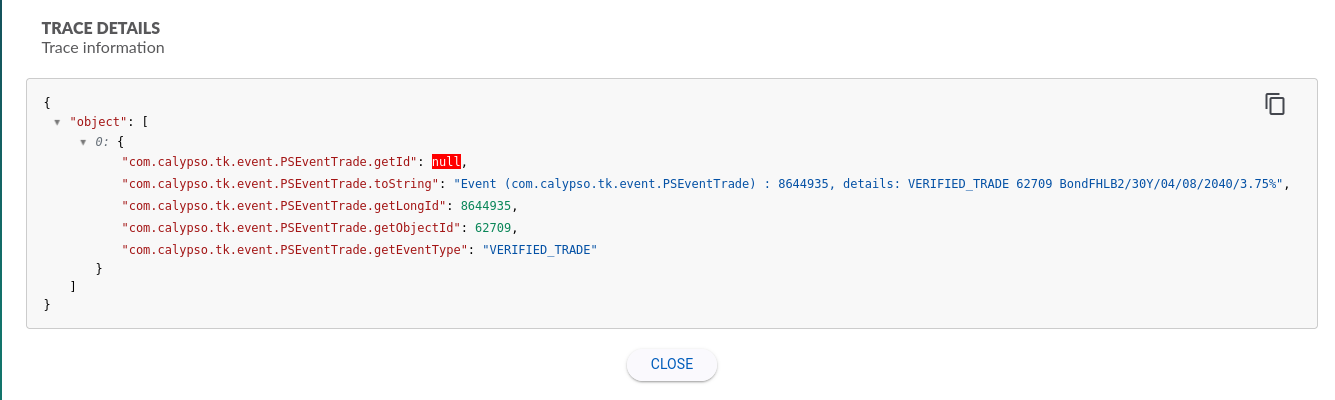
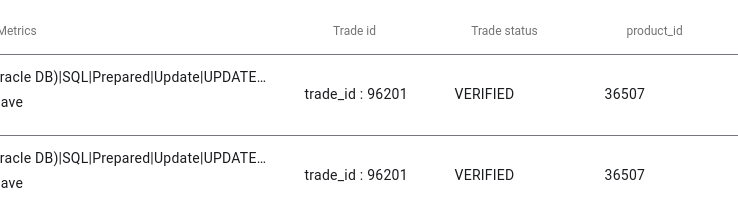
Context tracer are stored in a JSON structure in the database, to ease the analysis in the portal, it possible to extract and display some values in columns.
There is already a list of objects that are displayed in details, to modify this list, configure on the Portal :
-
override_config/traces/trace-configuration.yml
There is up to 15 custom columns with :
- id: column1, column2 …. to column15
- name: the name of the column
- config: the data to display from the JSON
- type: how the data is searched
-
ANYLEVEL: in the JSON, find the property identified by the text invalue -
REGEXP: in the JSON, find the properties identified by the regular expression invalue
-
- type: how the data is searched
Here is an example of the file :
configurationTraces:
- id: column1
  name: 'Trade id'
  config:
	- type: ANYLEVEL
	  display-name: 'trade_id'
	  value: com.calypso.tk.core.Trade.getLongId
	- type: ANYLEVEL
	  display-name: 'trade_id'
	  value: com.calypso.tk.event.PSEventTrade.getObjectId
- id: column2
  name: 'Trade status'
  config:
	- type: ANYLEVEL
	  value: com.calypso.tk.core.Status.toString
- id: column3
  name: 'product_id'
  config:
	- type: ANYLEVEL
	  value: com.calypso.tk.core.Product.getId
	- type: REGEXP
	  value: 'com.calypso.tk.product.*.getId'
- id: column4
  name: TradeFilter
  config:
	- type: ANYLEVEL
	  value: com.calypso.tk.mo.TradeFilter.getName
- id: column5
  name: 'Book name'
  config:
	- type: ANYLEVEL
	  value: com.calypso.tk.core.Book.getName
Screenshots
Event :