Table of Contents
Those sets of files can be analyzed and/or shared in case of HPA issue:
| Component | Path |
|---|---|
| Server | {{hpa_base_dir}}/hpa/modules/introscope/logs/em.log* |
| Server | {{hpa_base_dir}}/hpa/modules/hpa-extractor-*/logs/* |
| Server | {{hpa_base_dir}}/hpa/modules/nginx/logs/output.log |
| Agent | {{hpa_agent_dir}}/wily/logs/* |
Agents behaviour
- In case of violent crash of the JVM, as the agent is running inside, it will also end up
- For JVM running very shortly, like ST, in a such context, agent can even miss its first sent of data to the portal, and then the ST execution could not appear into
- In case of JVM stop, the agent will send data immediately
- Depending on the nature of metrics captured by the agent, close to the JVM end, some values could be not fully accurate
- Specially true for some ST metrics, as they JVM life duration is limited compared to back-end components
Agents behaviour can also depends on customizations that can be partially visible here
Bad events number are inconsistent
In the PS EVENTS tile of Engines menu, if the number of bad events shown does not match the number displayed in the WebAdmin, it’s’most likely due to frequent restarts of the corresponding engine.
For instance, the Liquidation engine shows a high number of bad events (while the WebAdmin shows 0):

By examining the ENTRY POINTS tile and filtering on ‘EngineManager’, we can see that this engine manager has processed thousands of operations on the Liquidation Engine (see the ‘requests’ column). In essence, it indicates that the engine has been restarted numerous time:

Because the bad event count shown in WebAdmin corresponds only to the events recorded since the last restart, the value displayed in the PS EVENTS tile differs from what appears in WebAdmin.
Further details on the bad event metric and other JMX metrics are available on the Calypso Engine Server and Engine metrics page.
Data collection session 0 disk free space
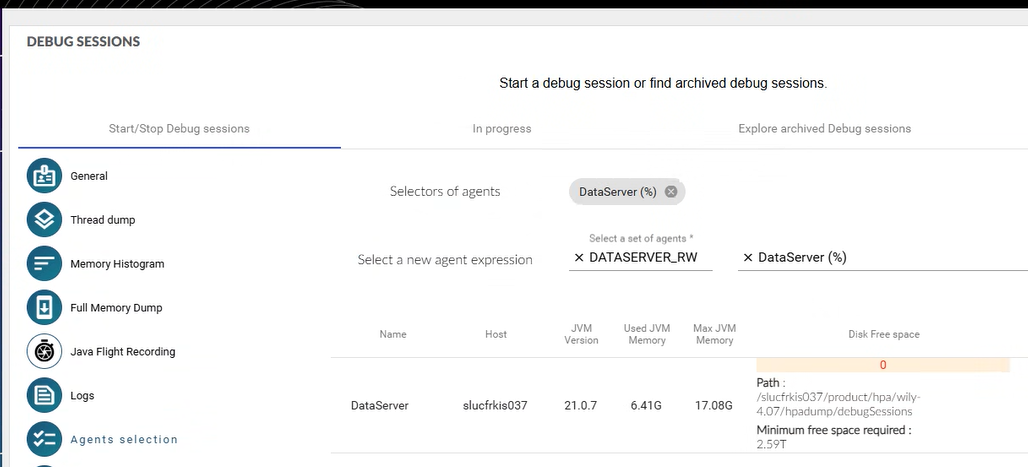
- Minimum free space required for the agents at 2.59T
- A property is missing in the agent profile
-
hpa.dumpDirectory.freeSpaceInMb=20000 - Details available here
- Disk free space for agent at 0 - for all agents of the same host
- The user used to deploy the agent is probably not the correct one or is not having the sufficient Linux privileges
-
Data collection session monitor not running on a host
- The user used to deploy the agent is probably not the correct one or is not having the sufficient Linux privileges
Deactivating HPA agents
3 ways are available to quickly deactivate the HPA agents:
- Select all the flags and services in the Agents Settings and deactivate them
- Does not require any Calypso JVM restart
- Change the
ENABLEvalue inhpa_agent_config.sh- Requires a Calypso JVM restart
export ENABLE=0
- Rename the HPA agent folder
- Requires a Calypso JVM restart
Error log in agents file
HPA log files can meet errors into:
- feature is deactivated to save overhead but error trace can not be disabled, occurs during startup
[ERROR] [IntroscopeAgent.Agent] Cannot create the lock file for persistence api in null
[ERROR] [IntroscopeAgent.ExtensionDeployer] Cannot create the lock file in <path>
- during the startup, agent register itself on EM, sometimes first attempt is not successful, so it trace a log and retry automatically.
[ERROR] [IntroscopeAgent.Agent] The com.hexagon.wily.service.HpaAgentBeanService extension was unable to register the bean
- feature is deactivated to save overhead but when HPA settings are changed, class redefinition can occur and then this log is displayed in agent logs.
[ERROR] [IntroscopeAgent.Agent] IntervalHeartbeat.execute threw executing: Introscope Dynamic Instrumentation Behavior
java.lang.NullPointerException: Cannot invoke "com.wily.util.task.AsynchExecutionQueue.IExecutionQueue_addExecutableItem(com.wily.util.task.IExecutableItem)" because "this.fAgeAllQueue" is null
at com.wily.introscope.agent.trace.hc2.WilyTransactionStructure.ageAllImmediately(WilyTransactionStructure.java:2981)
at com.wily.introscope.autoprobe.dynamic.InstrumentationManager.wrapUpRedefinition(InstrumentationManager.java:459)
at com.wily.introscope.autoprobe.dynamic.InstrumentationManager.processAllClasses(InstrumentationManager.java:412)
at com.wily.introscope.autoprobe.dynamic.InstrumentationManager.access$2(InstrumentationManager.java:360)
at com.wily.introscope.autoprobe.dynamic.InstrumentationManager$DirectivesSyncBehavior.ITimestampedRunnable_execute(InstrumentationManager.java:566)
at com.wily.util.heartbeat.IntervalHeartbeat$BehaviorNode.execute(IntervalHeartbeat.java:972)
at com.wily.util.heartbeat.IntervalHeartbeat.executeNextBehaviorAndCalculateSleepTime(IntervalHeartbeat.java:491)
at com.wily.util.heartbeat.IntervalHeartbeat.access$2(IntervalHeartbeat.java:445)
at com.wily.util.heartbeat.IntervalHeartbeat$HeartbeatRunnable.run(IntervalHeartbeat.java:668)
at java.base/java.lang.Thread.run(Thread.java:840)
Extractor OOO (from 2026.05.02)
- In case of OOO (Out Of Memory) issue on the hpa extractor, memory must be increased by modifying environment.config and restarting the extractor only (cf just below)
- Same option available for Hpa portal
Extractor OOO (until 2026.05.01)
- In case of OOO (Out Of Memory) issue on the hpa extractor, memory must be increased:
- Edit the file
{{hpa_base_dir}}/hpa/versions/<version>/hpa-extractor-<extractor version>/module_controller.bash - Modify the line
HPA_MODULE_JOPTS="$HPA_MODULE_JOPTS -Xmx2G"and consider the value to use - Stop the extractor via the controller
{{hpa_base_dir}}/hpa/./controller.sh stop hpa-extractor-<extractor version> - Start again (the controller starts only the stopped component(s))
{{hpa_base_dir}}/hpa/./controller.sh start
- Edit the file
JVM memory allocation
-Xmx runtime parameter sets the Maximum amount of JVM Heap Memory for this JVM. An additional parameter, that is usually used in tandem with -Xmx, is -Xms, which controls the initial allocation of JVM Heap Memory.
For example, if the -Xms512m -Xmx3g combination of parameters were used to start a Java program, HPA would show 512 MB as the value GC Heap:Bytes Total metric. When the GC Heap:Bytes In Use reaches a certain point near the 512 MB mark, the JVM will increase the GC Heap:Bytes Total metric by a certain percentage (the exact number depends on the JVM provider and the GC algorithms used).
If the Heap memory usage ever grows (due to a potential memory leak or an unoptimized JVM heap for this particular application usage), the JVM will throw a java.lang.OutOfMemoryError indicating that a maximum of 3GB of HEAP allocated to this JVM was not enough to perform its activities.
To avoid false alert when monitoring the memory usage of a JVM, it is recommended to set the threshold to 95% or higher for GC Monitor:Percentage of Java Heap Used.
KPI folder almost empty after a Data Collection
If netstat is missing on the host running the HPA agent, the Data Collection output will be incomplete
Missing metrics
Each agent profile is defining a max number of metrics it can record, a metric being defined by its full name
Beyond this value metrics are no more recorded
At the agent restart, the counter comes back to 0
This state can be checked thanks to self monitoring metrics
For some metrics, their number can be optimized by removing some attributes of the metrics
Some less useful metrics can be also deactivated via the agents settings, but a restart is required to reset the recorded metrics for the current agent session
Navigator names are too numerous
Cf this link
Nginx
-
nginx: [emerg] bind() to 0.0.0.0:443 failed (13: Permission denied)- Visible in the nginx output.log file
- If nginx is listening on a port lower than 1024, special rights must be allocated
- Those rights can disappear when nginx is reinstalled or when security policies patches are deployed
- The best action to correct this issue is to launch this command
-
setcap cap_net_bind_service=ep {{hpa_base_dir}}/hpa/modules/nginx-<nginx version>-bin/sbin/nginx
-
No metric captured
- First root cause can be the closed flows between Calypso server(s) and Hpa server
- Second root cause can be a generic APM, instrumenting Java classes but not accepting any other Java agent running in memory
Dynatrace® example:
- Disabling JVM auto-injection done by Dynatrace:
- OneAgent monitoring modes
- Switch Host to Infrastructure monitoring
- Turn off auto-injection : Disable auto-injection for a single host