A summary of the alerts raised on the selected period is displayed on the homepage.
Alerts counters
The card counts the alerts by severity (Danger, Caution) with the total of configured alerts.

Management modules
Each alert belongs to a management module defined in the EM. By default two management modules exist:
- Hpa Self Monitoring
- Calypso
The link under the counters (ticked / total management modules) unfolds the list of the
management modules of the loaded alerts while the mouse hovers it; a click folds it, a second
click keeps it unfolded after the mouse leaves. All the management modules are ticked by default, and the counters only
include the ticked ones. The selection is saved per user and per environment, and a management
module that appears later is ticked by default. A vertical scroll bar is shown when the list is
long.
Icon colour
The icon colour depends on the alerts in Danger of the ticked management modules:
- red above the red threshold;
- amber above the amber threshold;
- green otherwise;
- grey when no management module is ticked.
The same 4 alerts in Danger out of 64, with three different thresholds:

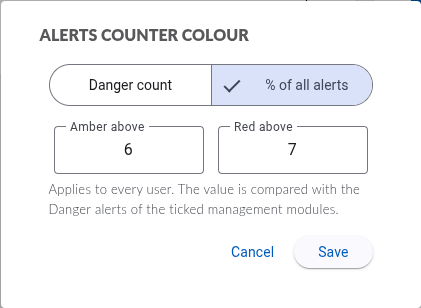
The thresholds apply either to the number of alerts in Danger, or to the alerts in Danger as a percentage of all the alerts. The default is amber above 5 and red above 10 alerts in Danger. The tooltip of the icon recalls the thresholds in use.
The thresholds are common to every user. An administrator changes them with the gear icon of the
card: Danger count compares the number of alerts in Danger, % of all alerts their percentage.
A click on the icon opens the Alerts page.
Alerts per domains
The Alerts page displays each management module with the number of alerts raised on the period, split by severity (Danger or Caution) with the total of configured alerts.

If an alert contains the keyword Heartbeat then it’s not displayed by default. These kind of
alerts are used to notify an external alerting system for example. The “Include heartbeat alerts”
toggle of the Alerts page includes them.