Because the webview doest not displayed easily information on stopped agent (like an ST which start and stop a moment later), we added this section : it enables to load a set of metrics and display them on graph.
This section does not aim to be a custom dashboard, something like Grafana will be integrated in a next release to offer custom dashboards.
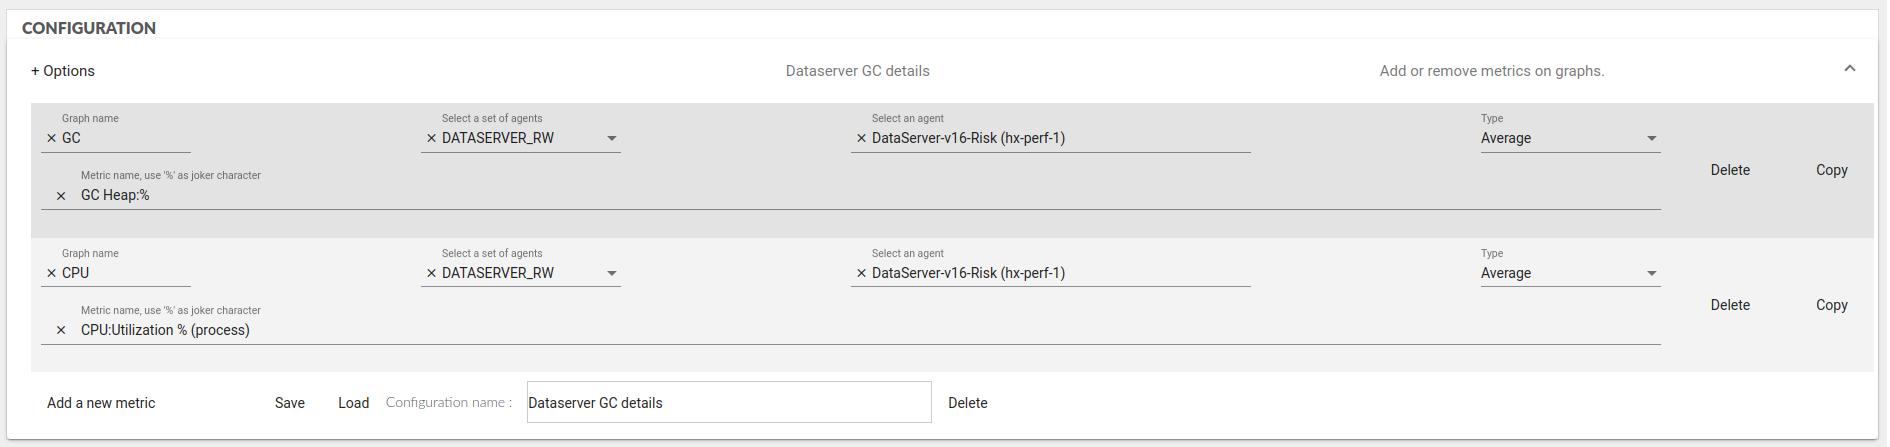
Create a graph
You can select a set of metric and display it on a given graph.
- add a metric by clicking on
Add a new metric - set a graph name : all metric with the same graph name will be displayed on the same graph
- select a set of agents : this is the categories described in Environment
- select one agent in the selected category
- select the dimension :
- Average
- Min
- Max
- Count
- select the metric : you can use the token
%to select multiple metrics - set a
Configuration name - click on save
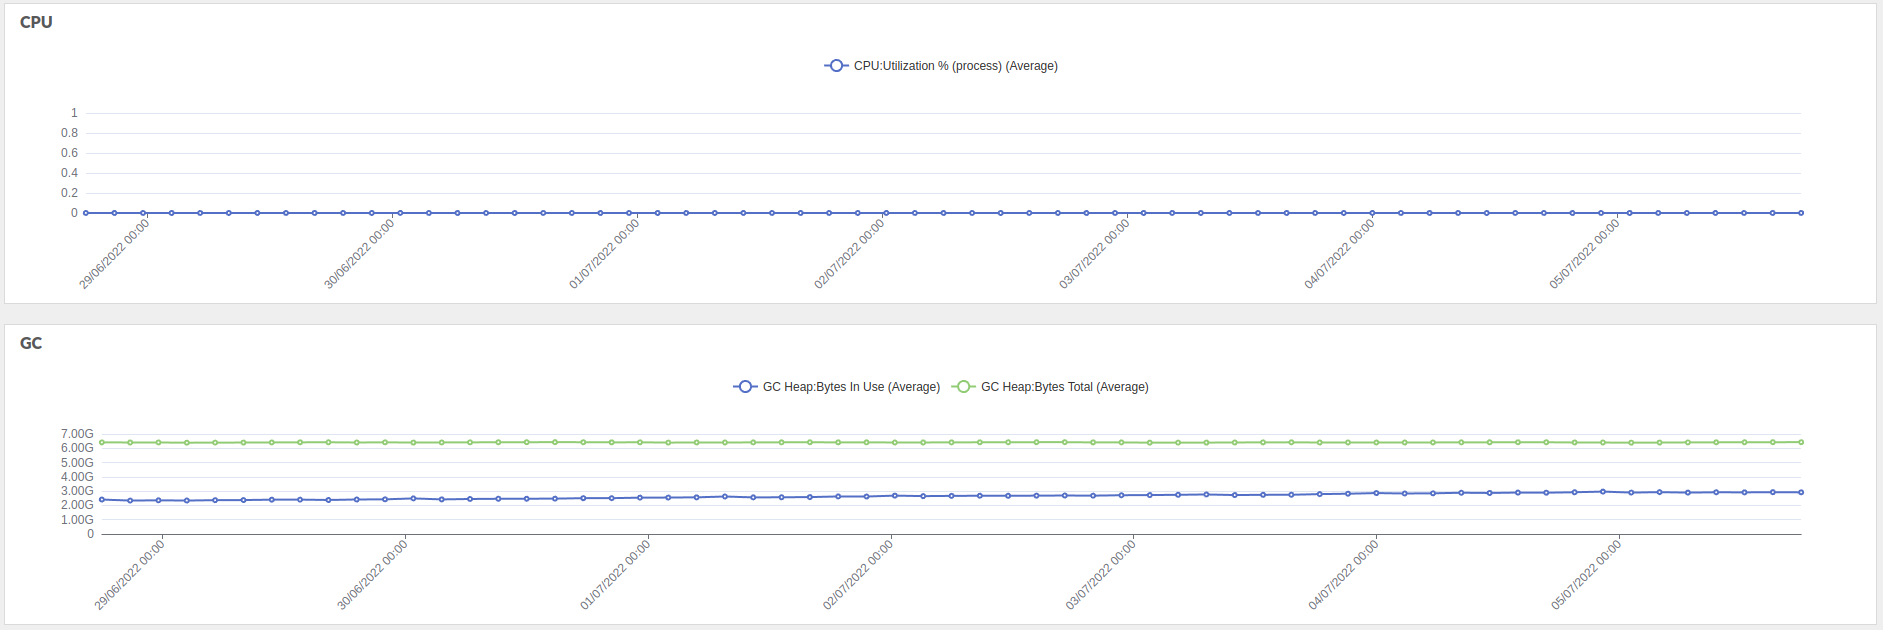
Graph
The graphs are displayed when click on Save, all the configuration with the same graph name are displayed on the same graph.
Configuration management
You can delete a metric :
- click on the
Deletebutton on the same line as the metric description
You can load a configuration :
- select a configuration
- click on
Load
You can delete a configuration :
- select a configuration
- click on
Delete